Guide6 August 2026· 12 min read

Third-Party Dependency Monitoring: When Someone Else's Outage Becomes Yours

Your Uptime Is Not Entirely Your Own

Open the network tab on almost any modern web application and count the hostnames. A typical product loads a payment processor, an authentication provider, an analytics script, a support widget, a CDN, a font service, a feature flag API, an email delivery platform, and a map or search provider. Behind the scenes there will be more: object storage, a managed database, a queue, a geolocation lookup, a tax calculation service. Very little of the code that determines whether a customer can complete a purchase is code that your team wrote or runs.

This is a good trade. Nobody should be building their own payment rails or certificate authority. But it changes the shape of reliability work in a way that many teams have not fully absorbed. Your availability is now a product of every dependency in the critical path, and if you have ten services that are each independently up 99.9 percent of the time, the naive combined availability is closer to 99 percent. That is roughly seven hours of degradation a month arriving from directions you do not control.

The uncomfortable part is that when a vendor fails, your customers do not experience a vendor outage. They experience your product being broken. They post about your brand, they open tickets with your support team, and they judge your reliability. "Our payment provider was down" is an explanation, not an excuse, and it only lands well if you can say it quickly and accurately. That requires knowing before the customer does.

Third-party dependency monitoring is the practice of watching the services you rely on but do not operate, from your own perspective rather than theirs. This guide covers how to inventory what you depend on, how to detect the partial failures that vendor status pages routinely miss, how to design your application so a supplier's bad hour is not your bad hour, and how to handle alerting and customer communication when the fault is genuinely someone else's.
Start With an Honest Dependency Inventory

Almost every team underestimates its dependency count, usually by a factor of two or three. The list that lives in someone's head covers the obvious platform pieces. It misses the analytics tag a marketer added through a tag manager, the address autocomplete service embedded in the checkout form three years ago, and the internal library that quietly calls an external geolocation API on every request.

Build the inventory properly once, then keep it current. Useful sources to reconcile against each other:

  • Outbound network traffic from your production environment, which is the only source that tells you the truth rather than what people believe to be true.
  • The browser network tab on your key pages, capturing everything the client loads directly, including tag manager injections.
  • Infrastructure and vendor billing, which is an excellent way to find services nobody remembers signing up for.
  • Configuration and secrets, since every API key in your environment variables represents a dependency.

Once you have the list, the important work is classification. Not all dependencies deserve the same treatment, and trying to monitor all of them at the same intensity produces noise rather than safety. Sort each one by what happens to the customer when it fails:

  • Critical path: if this is down, the core journey stops. Payment processing, authentication, the primary database, the CDN serving your application bundle. These need active monitoring and rehearsed failure plans.
  • Degraded experience: the product works but something visible is broken or missing. Search, recommendations, maps, avatars. These need monitoring and a defined fallback state.
  • Background: failures are invisible to users in the moment but accumulate. Email delivery, webhooks to partners, analytics ingestion, data warehouse syncs. These need monitoring precisely because nobody notices, which is what makes them dangerous.
  • Cosmetic: fonts, chat widgets, non-essential scripts. Worth knowing about, not worth waking anyone for. These should be loaded in a way that cannot block rendering.

Record two extra things for each entry: what the customer-visible symptom is when it fails, and what your application currently does when it times out. That second column is often the moment a team discovers that a "cosmetic" script is loaded synchronously in the document head and can therefore take the entire page down on its own.

How Dependencies Actually Fail

If third-party services failed cleanly, this would be a much shorter article. A hard, unambiguous outage is the easiest case: connections refused, an obvious error, and usually a vendor status page that says so. The failures that hurt are the ambiguous ones, where the service is technically responding and every simple health check says everything is fine.

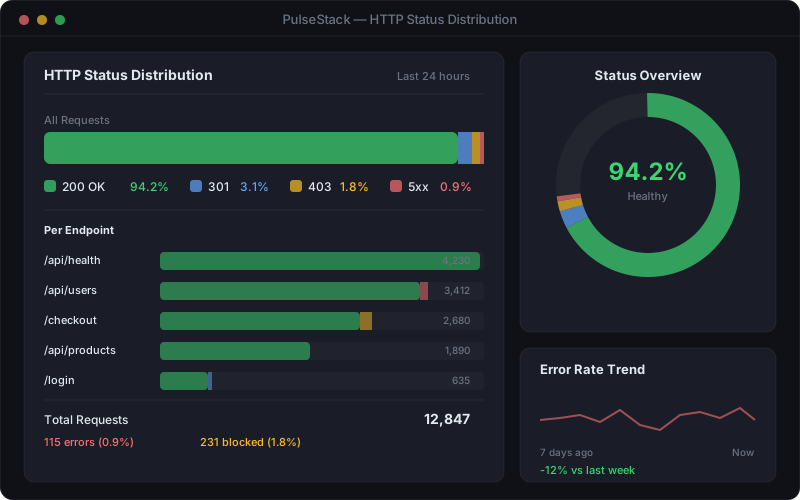
PulseStack HTTP status code breakdown showing the distribution of 2xx, 4xx, and 5xx responses from a monitored endpoint over time
An elevated error rate against a third-party endpoint is often the earliest signal of a vendor problem, well before it appears on their status page

The patterns worth designing around:

  • Slow rather than down. The most damaging third-party failure mode by a wide margin. Response times climb from 200ms to 12 seconds, requests eventually succeed, and your own connection pools and worker threads fill with requests waiting on a supplier. A dependency that is merely slow can take down a service that would have survived it being completely offline, because at least a refused connection fails fast.
  • Partial and regional. The vendor is healthy in their primary region and struggling in another. Your European customers see failures while your dashboard, checked from a single location, looks perfect. This is the same argument that drives multi-location monitoring for your own endpoints.
  • Correct-looking but wrong. The API returns HTTP 200 with an empty result set, a stale cached response, or a payload missing a field your code assumes is present. Status code checks pass happily while the feature is broken.
  • Rate limited or quota exhausted. Not an outage at all, but indistinguishable from one for the affected users. Frequently triggered by your own traffic growth or a retry storm you created while responding to something else.
  • Silently deprecated. An endpoint or API version is retired on a schedule you did not track, and something that has worked for two years stops on a Tuesday morning.
  • Certificate and domain expiry. Vendors let certificates lapse too, and a self-hosted webhook receiver or partner integration with an expired certificate fails exactly as hard as your own would.

Notice how few of these are detected by asking "did it return 200?". Effective dependency monitoring checks correctness and latency, not just reachability.

Monitoring Services You Do Not Control

You cannot instrument a vendor's infrastructure, so you monitor the surface you can reach: their public endpoints, their status feeds, and above all your own application's experience of calling them. That last one is the most valuable and the most commonly missing.

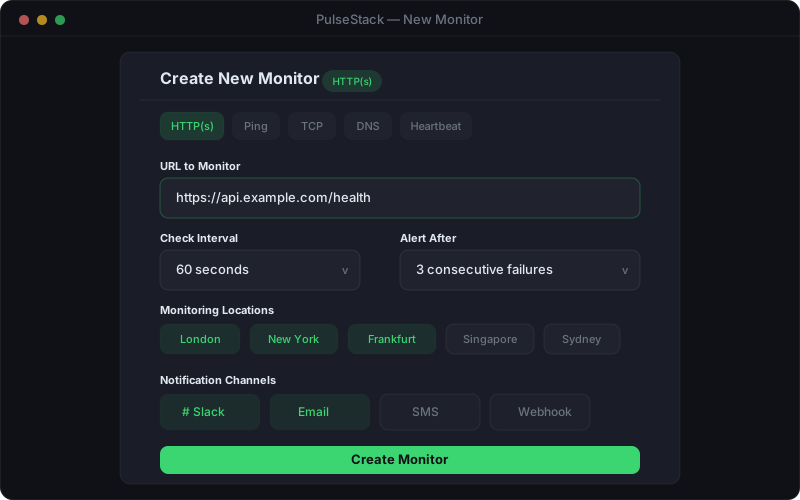
PulseStack monitor configuration screen showing endpoint URL, check interval, expected response settings, and alert routing for an external API dependency
External dependencies deserve the same configured checks as your own endpoints: interval, expected response content, and a clear alert route

Build the coverage in layers, from cheapest to most valuable:

1. Synthetic checks against the vendor's public API. Hit a lightweight, ideally free endpoint on a regular interval and assert on more than the status code. Most providers offer a health, ping, or version endpoint suitable for this. Check response time against a threshold as well as availability, because latency is your early warning. The techniques in our API monitoring guide apply directly here, with one difference: keep the request cost low and the interval sane, because you are consuming someone else's quota.

2. Content and correctness assertions. Where the endpoint returns data, assert on the shape of it. A check that requires a specific JSON key to be present, or a keyword to appear in the response body, catches the "200 but wrong" class of failure that a status-code check waves straight through. This is also how you notice a deprecation notice appearing in a response header.

3. Vendor status pages, consumed automatically. Most providers publish a machine-readable status feed. Subscribe to it rather than trusting anyone to remember to look. Treat it as supporting evidence and never as your primary signal: vendor status pages are updated by humans, usually after their own investigation, and they routinely lag real customer impact by fifteen to sixty minutes. A green status page while your error rate climbs means your data is right and theirs is late.

4. Your own application's view, which matters most. Instrument every outbound call with the same rigour you apply to inbound requests: success rate, error rate broken down by status, latency percentiles, and timeout count, tagged by dependency. This is the only layer that reflects your actual traffic, your authentication, your payload sizes, and your network path. When these metrics diverge from your synthetic checks, the difference is usually where the interesting problem lives.

5. End-to-end journey checks. A synthetic transaction that walks a real user path (add to basket, begin checkout, submit a test payment against a sandbox) exercises the whole chain including the dependencies inside it. These are more expensive to build and maintain, so reserve them for the two or three journeys that actually generate revenue.

Set thresholds from the dependency's normal behaviour rather than a generic number. A payment authorisation that usually takes 400ms and now takes 2 seconds is a serious signal, even though 2 seconds would be unremarkable for a batch reporting API. Our guide to setting response time thresholds covers how to pick these from percentiles rather than averages.

Designing So a Vendor's Bad Hour Is Not Yours

Monitoring tells you that a dependency has failed. Architecture determines how much that costs you. The teams that survive supplier outages calmly are not the ones with better alerting; they are the ones whose applications were built expecting failure.

The controls that deliver the most protection for the least effort:

  • Aggressive, explicit timeouts. Every outbound call needs a timeout set deliberately, and it should be a small multiple of the dependency's normal p99 rather than a comfortable-sounding round number. Library defaults are frequently 30 seconds or infinite, which is how a slow vendor exhausts your thread pool. Set connect and read timeouts separately.
  • Circuit breakers. After a threshold of consecutive failures, stop calling the dependency entirely for a cool-off period and fail fast into your fallback. This protects you from queueing behind a dead service and protects the vendor from your retries during their recovery.
  • Bounded retries with jitter. Retry sparingly, with exponential backoff and randomisation, and never retry a non-idempotent operation blindly. Synchronised retry storms from thousands of clients are a well-documented way to turn a vendor's brief blip into a prolonged outage.
  • Bulkheads. Give each dependency its own connection pool or worker allocation so that one saturating service cannot starve the others. Without this, an outage in your recommendations provider can take down checkout.
  • Cached and default responses. A slightly stale exchange rate, a cached tax table, or a generic recommendation list is almost always better than an error page. Decide the acceptable staleness in advance rather than during the incident.
  • Queue and reconcile for asynchronous work. If the dependency is not needed to answer the user right now (analytics events, notification sends, partner webhooks), buffer the work durably and replay it when the service recovers. The customer never sees the outage at all.
  • Feature flags for external features. Being able to switch off a non-essential third-party feature in seconds converts an incident into a shrug. This is one of the highest-value pieces of incident tooling a team can own.
  • Non-blocking client-side loading. Third-party browser scripts should be loaded asynchronously with a defined failure behaviour. A synchronous script from a hung host will block rendering for as long as the browser is willing to wait.

All of this needs rehearsing. Block a dependency at the network level in a staging environment and watch what your application actually does. The gap between what a team believes happens on timeout and what happens in practice is usually large, and finding it during a game day is very much cheaper than finding it at 3am.

Alerting and Ownership When the Fault Is Elsewhere

A dependency alert raises an awkward question that internal alerts do not: what is the person receiving it supposed to do? They cannot fix a payment provider. If the answer is "nothing", the alert will be ignored within a fortnight, and it will still be ignored on the day it matters.

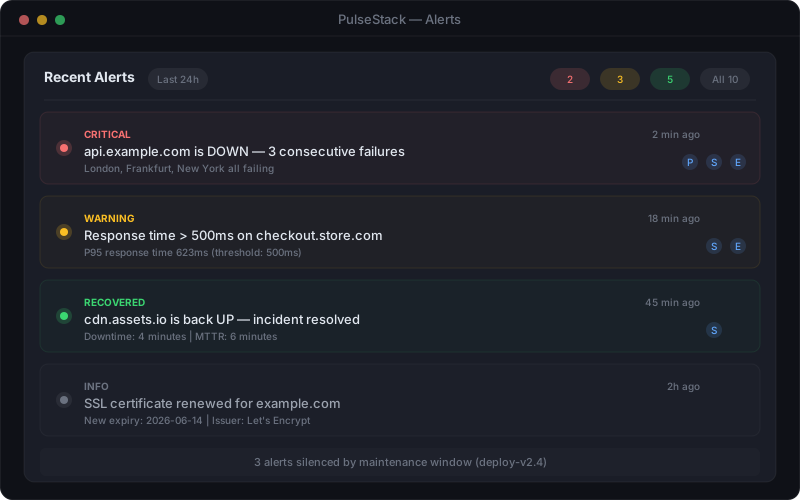
PulseStack alert notification panel showing active dependency alerts with severity, affected service, and acknowledgement status
Dependency alerts should name the vendor and the customer-visible symptom, so the responder knows immediately which playbook applies

Make every dependency alert actionable by defining the response before you create it. A useful dependency alert answers three things in its own text: which vendor, what the customer sees right now, and what the first action is. "Payment provider error rate above 5 percent, checkout affected, see the payments dependency runbook" is a page worth receiving. "External API check failed" is not.

The actions available during a vendor outage are limited but real, and they are worth having written down: activate the fallback or disable the feature by flag, switch to a secondary provider if one is configured, post a customer-facing update, open a ticket with the vendor with your own timestamped evidence, and set a review point rather than watching continuously. Each is a decision someone must be authorised to make at 3am without escalating.

A few routing principles keep these alerts trustworthy, and they build directly on the practices in our guide to avoiding alert fatigue:

  • Severity follows customer impact, not vendor importance. A critical-path dependency failing is a page. A background dependency failing is a ticket in working hours, even if the vendor is expensive and important.
  • Require confirmation across locations and consecutive checks before paging, since a single failed request to a remote third party is frequently a network blip rather than an outage.
  • Suppress the downstream noise. One vendor failure can trigger fifteen internal alerts. Group them so responders see one incident with a named cause, not a wall of symptoms.
  • Give every critical dependency a named internal owner. Not to fix it, but to hold the relationship: they know the support escalation path, the contract commitments, and the history. Without this, incidents involving vendors drift because nobody feels responsible for chasing.

Vendor service commitments are worth reading before you need them, and worth checking your own data against. Most providers require the customer to claim credits, within a window, with evidence. Your monitoring history is that evidence, which is a quietly practical reason to keep independent records rather than relying on a supplier's own reporting.

Communicating When It Is Not Your Fault

Customers are remarkably forgiving about third-party failures, provided two conditions are met: you tell them promptly, and you do not sound like you are hiding behind the supplier. Both are easy to get wrong under pressure.

Post an update as soon as you have confirmed customer impact, even if you do not yet know the cause or the duration. Waiting for certainty is the most common communication mistake, because the interval between "users are affected" and "we understand why" is exactly when your support queue fills up. Describe the symptom in terms of what the customer can and cannot do, name the workaround if one exists, and give a time for the next update rather than an estimate for the fix.

Naming the provider is usually the right call when the outage is public and widely reported, and it helps customers understand why the problem is not resolving on your schedule. What matters is the framing. "Our payment provider is experiencing an outage; we have paused checkout and are holding your basket, next update at 14:30" is honest and reassuring. "This is a third-party issue, nothing we can do" tells the customer that their problem is not your problem, which is the opposite of the message you want to send. You chose the vendor, the integration is yours, and the recovery plan is yours.

Keep the record on your own status page rather than only in a support macro, and link to the vendor's incident if there is one. When it is resolved, follow the normal process: a post-incident review for a vendor outage is just as valuable as one for your own failure, because the useful findings are almost never about the vendor. They are about how long detection took, whether the fallback worked, whether the runbook existed, and whether that dependency should be single-sourced at all.

Making Dependency Risk a Routine Practice

Dependency risk grows quietly. Every sprint adds an integration, and nothing in a normal development process ever removes one or reassesses the ones already there. A light recurring review keeps it from compounding.

Once a quarter is enough for most teams. Refresh the inventory against real outbound traffic, since the drift from the documented list is the finding. Check that every critical-path dependency still has monitoring, a defined fallback, and a named owner. Review the incidents of the last quarter for how many were triggered externally and how many were detected by you rather than by the vendor. Look for concentration: several "independent" services sitting in the same cloud region is a correlated risk pretending to be a diversified one. And check the pipeline of change, including deprecation notices and version sunsets, which are the failures you can schedule instead of suffer.

Two questions are worth asking about every critical dependency, and they are business questions as much as technical ones. First, how long could we operate without this, and what does the customer experience during that time? Second, if this vendor disappeared permanently, how long would replacing it take? Answering the second honestly is often what justifies the effort of building an abstraction layer or a secondary provider for the one or two dependencies where it genuinely pays off. Not everything needs redundancy, but the things that would end your business deserve a plan that is not a hope.

Underneath all of it sits detection, because every response option you have depends on knowing early. PulseStack monitors external endpoints alongside your own, with content assertions that catch the responses that look healthy but are not, checks from multiple locations to catch regional vendor failures, response time thresholds tuned per monitor, and alerting that routes to the person who can act. See how API monitoring handles external services, how website monitoring covers the journeys your dependencies sit inside, or compare the plans to find the right fit. Your customers will never care whose infrastructure failed. They will care how quickly you noticed and how well you handled it.

Start monitoring your infrastructure today

50 free monitors, no credit card needed. Set up in under 30 seconds.

Get started free