Guide27 July 2026· 11 min read

Response Time Monitoring: Setting Thresholds That Matter

The Signal Before the Outage

Most teams treat a website as binary: it is either up or it is down. But the reality of how services fail is far more gradual. Long before a page returns an error, it gets slow. Requests that used to complete in 200 milliseconds start taking a second, then two, then five. Users abandon their carts, search engines quietly downgrade the page, and your support queue fills up, all while your uptime dashboard still shows a reassuring green tick. This is exactly why response time monitoring is one of the most valuable signals you can collect.

Response time is the earliest warning you get that something is wrong. A database that is starting to struggle, a memory leak that is slowly filling the heap, a downstream API that is degrading, a traffic spike your infrastructure cannot quite absorb: every one of these shows up as rising latency well before it shows up as a hard failure. A team that watches response time closely catches problems in the amber zone, while a team that only watches availability waits until the page is fully broken. The difference is the gap between a quiet fix and a public incident.

The catch is that response time is only useful if you set the right thresholds. Alert too aggressively and you drown in noise; alert too loosely and you miss the degradation entirely. This guide covers what response time actually measures, how to choose warning and critical thresholds that reflect real user pain, why percentiles matter far more than averages, and how to turn all of it into alerting that your team will actually trust. It builds directly on the foundations covered in our complete guide to uptime monitoring.
What Response Time Actually Measures

Before you can set a threshold, you need to be precise about what you are measuring, because "response time" is not a single number. A single request passes through several distinct phases, and a slowdown in each one points to a different root cause.

  • DNS lookup: the time to resolve your hostname to an IP address. Slow or failing lookups usually point to DNS configuration problems, covered in our DNS monitoring guide.
  • TCP connection and TLS handshake: the time to open a socket and negotiate encryption. A rising handshake time can indicate certificate or protocol issues.
  • Time to First Byte (TTFB): the time from sending the request to receiving the first byte of the response. This is the single most important server-side number, because it isolates how long your backend took to start producing an answer.
  • Content download: the time to transfer the full response body. Large or uncompressed payloads inflate this phase.

For monitoring purposes, the two numbers you will lean on most are TTFB and total response time. TTFB tells you how your server and its dependencies are performing, stripped of network and payload effects. Total response time tells you what the user, or a search engine crawler, actually experienced end to end. When TTFB is healthy but total time is slow, the problem is in the payload or the network. When TTFB itself is climbing, the problem is inside your application or one of the services it depends on.

It is also worth separating synthetic response time from real user response time. Synthetic checks run from controlled probes on stable connections and give you a clean, comparable baseline. Real user timings capture the messy truth of actual devices and networks. Both matter, and the distinction is explored fully in our comparison of synthetic monitoring versus real user monitoring. For threshold setting, synthetic measurements are the better starting point precisely because they are consistent.

Setting Thresholds That Matter

A threshold is a promise to your team: "if response time crosses this line, it is worth someone's attention." Set it well and every alert means something. Set it badly and the team learns to ignore the alerts, which is worse than having none at all. The goal is to anchor your thresholds to real user behaviour rather than arbitrary round numbers.

The research on user tolerance has been remarkably stable for decades. Roughly speaking, a response under 100 milliseconds feels instant, up to about one second keeps the user's train of thought intact, and beyond a few seconds attention starts to drift and abandonment climbs steeply. Those human limits give you a sensible default two-tier structure for most web pages and APIs:

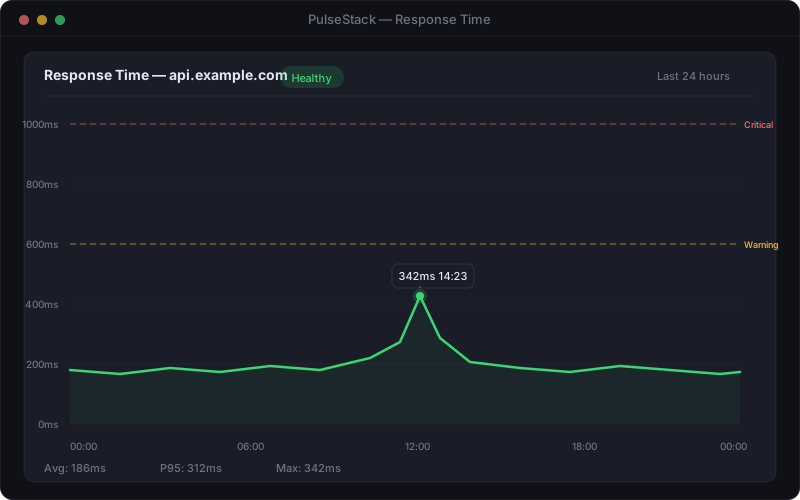
  • Warning threshold: around 1.5 seconds. At this point the experience is noticeably sluggish but still functional. A warning is a nudge to investigate, not to wake anyone up.
  • Critical threshold: around 3 seconds. Beyond this, users are abandoning in significant numbers and the page is effectively failing its job even though it technically loads. This deserves an active alert.
PulseStack response time monitoring chart showing warning and critical threshold lines plotted against measured latency over time
A two-tier threshold model: a warning band that flags degradation early and a critical band that signals genuine user-facing pain

These defaults are a starting point, not gospel. A marketing landing page and a real-time trading API have wildly different expectations, so calibrate against your own baseline. The reliable method is to measure your normal response time over a representative period, then set the warning threshold well above your typical peak and the critical threshold at the point where you know from your own data that conversion or engagement falls off a cliff. A threshold that fires constantly during normal operation is not a threshold, it is background noise, and it feeds directly into the alert fatigue that erodes trust in your entire monitoring system.

One more refinement: consider making thresholds relative as well as absolute. An alert that fires when response time is more than, say, three times its recent rolling baseline catches a service that has quietly doubled in latency even if it has not yet crossed a fixed line. Absolute thresholds catch bad performance; relative thresholds catch sudden change. The strongest setups use both.

Why Percentiles Beat Averages

If you take only one lesson from this guide, make it this one: never set thresholds on the average response time. The average, or mean, is the single most misleading number in performance monitoring, and relying on it will make your service look healthy while a meaningful slice of your users are suffering.

The problem is that averages hide their tails. Imagine a hundred requests: ninety-five complete in 200 milliseconds and five take a full 10 seconds because of a struggling database connection. The average is around 700 milliseconds, comfortably under a 1.5 second warning threshold, so nothing fires. Yet one in twenty of your users just waited ten seconds. The average smoothed away a serious problem that was hurting real people. This is why percentiles exist.

A percentile answers a far more useful question. The 95th percentile (written p95) is the response time that 95% of requests came in under. If your p95 is 1.2 seconds, it means 95% of users had an experience at least that fast, and only the slowest 5% were worse. Percentiles do not let the tail hide:

  • p50 (the median): the typical experience. Useful as a baseline, but it ignores the tail entirely.
  • p95: the standard choice for alerting. It captures the experience of the vast majority while remaining sensitive to the slow tail where real problems live.
  • p99: the worst 1% of requests. Critical for high-value flows such as checkout or login, where even a small percentage of very slow requests translates directly into lost revenue.

Set your warning and critical thresholds against p95, and add a p99 threshold for your most important user journeys. Watching the gap between p50 and p99 is itself diagnostic: when the median stays flat but p99 climbs, you have a tail problem such as lock contention, a cold cache, or an overloaded dependency affecting a subset of requests. That is precisely the kind of early signal that, caught in time, keeps your mean time to recovery low.

Location, Distance, and Fair Comparisons

Response time is not a property of your server alone; it is a property of the path between a user and your server. The same page can be fast from a probe next to your data centre and painfully slow from another continent, purely because of the physical distance and the number of network hops in between. If you measure response time from a single location, your thresholds will be calibrated to that one vantage point and blind to everyone else.

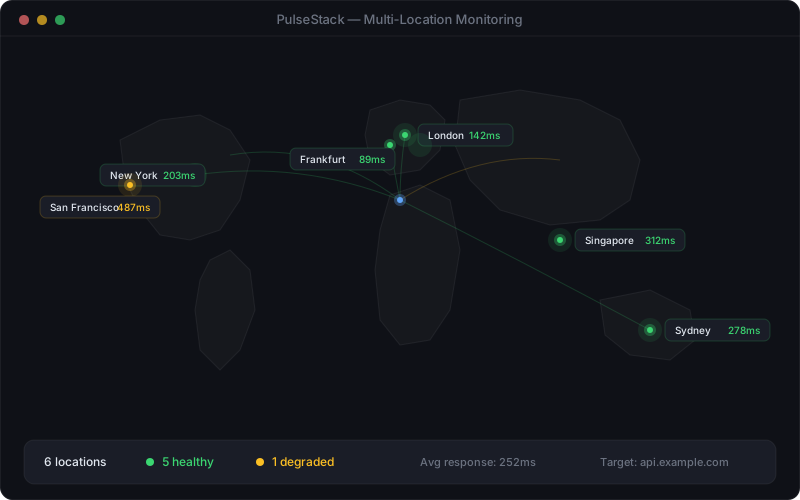
PulseStack multi-location monitoring map showing response time measured from probe locations across several continents
Measuring response time from multiple regions reveals latency that a single-location check would completely miss

This is why serious response time monitoring runs from multiple geographic locations. A checkout flow that responds in 400 milliseconds from London but 2.8 seconds from Sydney is not a healthy service for your Australian customers, and a single London probe would never tell you. Distributed checks also let you separate a genuine backend slowdown, which shows up everywhere at once, from a regional network problem or a misbehaving CDN edge, which shows up in one location.

Practically, this means you should either set per-region thresholds that account for the expected baseline latency to each area, or, more simply, evaluate each location against the same threshold and treat a breach in any region as worth investigating. A content delivery network changes this picture too: if you serve assets from the edge, response time from distant regions should stay low, and a sudden divergence between regions is a strong hint that an edge node or origin fetch is misbehaving. Fair comparison means comparing like with like, so always know which location a given measurement came from before you act on it.

Turning Thresholds Into Alerts Without the Noise

A threshold on its own is just a line on a chart. The value comes from converting a breach into an alert, and this is where most teams either under-react or, far more commonly, drown themselves in false alarms. Response time is naturally noisy: a single slow measurement can be caused by a transient network blip, a garbage collection pause, or a momentary traffic burst that resolves in seconds. If every single slow reading fires a page, your team will be exhausted and cynical within a week.

PulseStack alert notification panel showing a response time breach with severity, duration, and affected location details
Effective response time alerts carry context: severity, how long the breach has persisted, and which location and endpoint are affected

The discipline that fixes this is requiring persistence before alerting. Instead of firing on a single breach, require the threshold to be crossed for a sustained window, for example three consecutive checks or two minutes of elevated latency. A one-off spike self-resolves and is quietly logged; a genuine degradation persists and earns an alert. This single technique removes the overwhelming majority of false positives while barely delaying detection of real problems.

Layer that with a few more habits and your signal-to-noise ratio transforms:

  • Match severity to threshold: a warning breach goes to a low-priority channel for daylight-hours review; a critical breach triggers your on-call path. Not every slow reading deserves to wake someone.
  • Deduplicate related alerts: if ten endpoints slow down together because of a shared database, that is one incident, not ten pages.
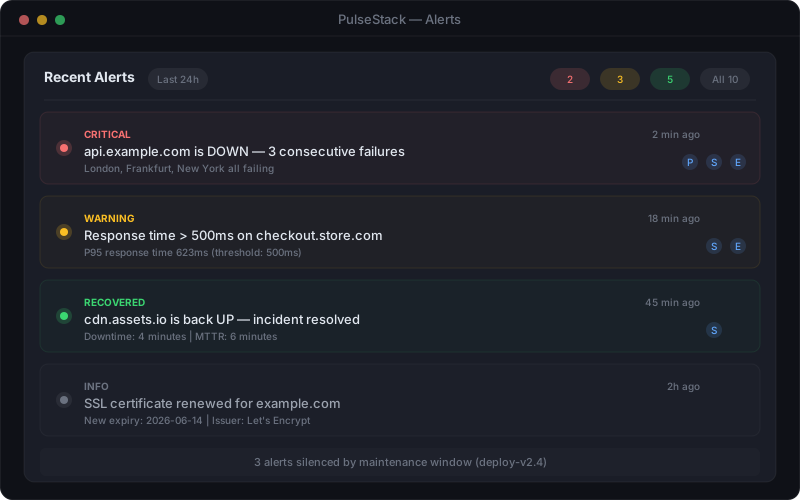
  • Give every alert context: which endpoint, which location, which percentile, and how far over the threshold. An alert that says "checkout p95 in Sydney has been over 3 seconds for four minutes" is actionable; one that says "response time high" is not.
  • Feed alerts into your incident process: a confirmed critical breach should flow straight into your incident management workflow, not sit in a channel nobody watches.

Done well, response time alerting becomes a trusted early warning system rather than a source of dread. Every alert that fires means a real human somewhere is having a measurably worse experience, and that is exactly the kind of alert engineers respond to willingly.

Building a Response Time Monitoring Practice

Bringing it all together, effective response time monitoring is less about any single number and more about a small set of good habits applied consistently. Start by measuring the right thing: track total response time and Time to First Byte separately, so you can tell a backend problem from a payload or network one. Establish a baseline from your own real traffic before you set any thresholds, because a threshold that ignores your normal behaviour is guaranteed to be wrong.

Set two tiers, warning and critical, anchored to genuine user tolerance rather than round numbers, and evaluate them against p95 and p99 instead of the average so the slow tail can never hide. Measure from multiple locations so distance and regional problems are visible, and compare each region fairly. Then convert those thresholds into alerts that require persistence before firing, carry real context, and map cleanly onto severity levels, so your team trusts every notification it receives.

Response time is the vital sign that changes first. A service almost never fails from perfect health to total outage in an instant; it slows down first, and that slowdown is your window to act before customers are affected. Teams that watch it well spend their time on quiet, unhurried fixes. Teams that ignore it spend their time writing post-mortems.

PulseStack measures response time on every check, from multiple locations, with configurable warning and critical thresholds and persistence-based alerting built in, so you catch degradation in the amber zone instead of the red. Explore the website monitoring capabilities to see how uptime, response time, and status checks work together, browse the full feature set, or review the plans to find the right fit for your stack. The best time to notice your site is getting slower is before your customers do.

Start monitoring your infrastructure today

50 free monitors, no credit card needed. Set up in under 30 seconds.

Get started free