Best Practice22 September 2026· 9 min read

Zero-Downtime Deployment Monitoring: How to Prove a Release Really Caused No Outage

Zero Downtime Is a Claim, Not a Guarantee

Almost every modern deployment pipeline promises zero downtime. Rolling updates replace servers one at a time, blue-green switches traffic between two identical environments, and canary releases send a small slice of users to the new version first. On paper, users never notice a thing.

In practice, many teams have no evidence that their releases are actually invisible. A deploy finishes, the pipeline turns green, and everyone moves on. Meanwhile a handful of requests failed during the switchover, a connection pool took forty seconds to warm up, or the new build returned errors on one route that nobody tested. None of this shows up in the pipeline, because the pipeline only knows that the deploy command succeeded, not that customers were served correctly throughout.

The gap matters more as release frequency rises. A team that ships twice a day and loses fifteen seconds of availability per deploy is quietly giving away several minutes of downtime a month, which can be enough to breach an availability target on its own. Worse, deploy related failures are the most common cause of incidents in many organisations, so the moments around a release are exactly when monitoring needs to be sharpest.

Zero-downtime deployment monitoring is the practice of measuring what users experience before, during and after every release, so that "zero downtime" becomes something you can prove rather than assume. This guide explains where deploy outages hide, what to measure, how to configure checks and alerts around release windows, and how to turn monitoring data into reliable rollback decisions.
Where Deployment Outages Hide

Deployment strategies remove the obvious outage of taking the whole site offline, but they introduce subtler failure modes. Knowing them tells you what your monitoring needs to catch.

  • Draining and switchover gaps. When an instance is removed from a load balancer, in-flight requests need time to complete. If connection draining is too short, or the process is killed before the load balancer notices, users see resets and 502 responses for a few seconds.
  • Cold starts and warm-up. A freshly started instance has empty caches, no JIT optimisation and fresh connection pools. It passes its health check instantly, then responds slowly for the first minute of real traffic.
  • Health checks that lie. Many health endpoints return 200 as soon as the process starts, before it can reach the database or load configuration. The orchestrator marks the instance ready and sends it traffic it cannot serve.
  • Schema and data mismatches. During a rolling deploy, old and new versions run side by side against the same database. A migration that renames a column or changes a queue message format can break whichever version did not expect it.
  • Configuration and secrets drift. A new environment variable missing from production, an expired credential, or a feature flag with a different default can pass every test and fail only in the live environment.
  • Cache and CDN side effects. Asset filenames change, the CDN still serves old HTML pointing at files that no longer exist, and pages render without styles or scripts while returning a perfectly normal 200.

Notice how many of these produce a successful HTTP status code. A deploy can be technically up while being functionally broken, which is why deployment monitoring has to look beyond "did the server answer" to "did it answer correctly and quickly".

What to Measure Before, During and After a Release

Useful deployment monitoring is built around three windows, each with a different question.

Before the release: what does normal look like? You cannot tell whether a deploy made things worse without a baseline. Record typical error rates, response times at the median and the 95th percentile, and the normal mix of status codes for your key endpoints. A week of data is usually enough to know the usual daily pattern, so that a Tuesday afternoon deploy is compared with a normal Tuesday afternoon rather than with a quiet night.

During the release: is anyone being hurt right now? This is where short intervals matter. Watch availability of the homepage and the most important user journeys, the rate of 5xx responses, and response time. Brief spikes in any of these while instances cycle are the signature of draining gaps and cold starts.

After the release: is the new version actually healthy? Some problems only appear once real traffic hits code paths that tests missed, or once a cache expires, or once a scheduled job runs against the new schema. Keep a closer watch for at least thirty to sixty minutes after the deploy finishes, and compare against the baseline rather than against an absolute threshold.

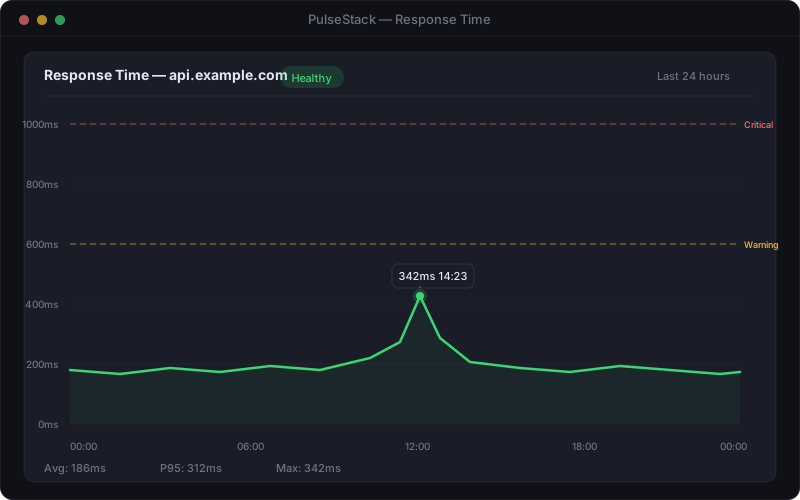
Response time chart showing a latency spike during a deployment window against warning and critical threshold lines
A short response time spike while instances restart is the classic sign of cold starts or aggressive connection draining

Across all three windows, a handful of signals do most of the work:

  • Availability of the homepage, login, checkout and your most used API endpoints, checked from outside your infrastructure.
  • Status code distribution, particularly the ratio of 5xx to total responses, and any sudden appearance of 404s on asset or API routes.
  • Response time at the median and tail. Tail latency often moves first, because a single slow instance only affects a fraction of requests.
  • Content correctness, meaning the page contains what it should. A keyword check that looks for a known phrase on a rendered page catches blank or half rendered pages that still return 200.
  • Background work, such as scheduled jobs and queue consumers, confirmed through heartbeats, because a broken worker produces no errors on the website at all.

Our guide to response time monitoring thresholds covers how to turn a baseline into warning and critical levels that reflect your own traffic rather than generic defaults.

Why External Checks Matter More Than Pipeline Checks

Most deployment pipelines include a smoke test: after the deploy, a script requests a few URLs and fails the pipeline if they do not return 200. This is worth having, but it has blind spots. The smoke test usually runs from inside your network, often against a single instance, and only once. It cannot see the load balancer, the CDN, DNS, TLS termination, or what happens to the other instances as they cycle.

External monitoring checks your service the way a customer reaches it: through public DNS, over the internet, via your CDN and load balancer, with a real TLS handshake. It also runs continuously, which means it sees the whole deploy window rather than a single moment after it. If one of four instances is broken, a pipeline smoke test has a three in four chance of missing it; a monitor checking every thirty seconds across a ten minute rollout will almost certainly hit it.

Checking from more than one location adds another layer. A deploy that changes DNS records, CDN rules or certificate configuration can break for some regions and not others, as edge caches and resolvers pick up changes at different times. Multi-location monitoring separates a real regional problem from a single network blip, and confirmation from several locations stops one flaky probe from triggering a rollback.

The best setup uses both: a pipeline smoke test that stops a clearly broken build from going further, and continuous website monitoring that tells you whether real users were affected at any point during and after the release.

Tuning Intervals and Alerts Around Release Windows

Deploy windows put monitoring under an awkward tension. You want the most sensitive detection possible, because this is when problems are most likely. But deploys can also produce brief, expected blips, and a flood of alerts for a two second draining gap trains people to ignore alerts altogether.

A few practices resolve this well:

  • Use short intervals for critical journeys. A one minute or thirty second interval on the homepage, login and checkout gives enough resolution to see a deploy window. Longer intervals can miss a whole rolling update between two checks.
  • Require consecutive failures before paging. Two or three failed checks in a row, confirmed from more than one location, filters out single request blips while still catching a real outage within a couple of minutes.
  • Keep the record even when you do not page. A blip that does not meet the paging threshold should still be logged. Those small, repeated gaps across many deploys are exactly the evidence that your process is not truly zero downtime.
  • Route deploy alerts to the person deploying. Whoever pressed the button is best placed to act, so send release related alerts to the team channel they are watching, and escalate to on-call only if the problem persists.
  • Avoid blanket muting. Pausing all monitoring during a release removes visibility at the moment you need it most. If you must suppress alerts, suppress notifications for known expected blips, not the checks themselves.
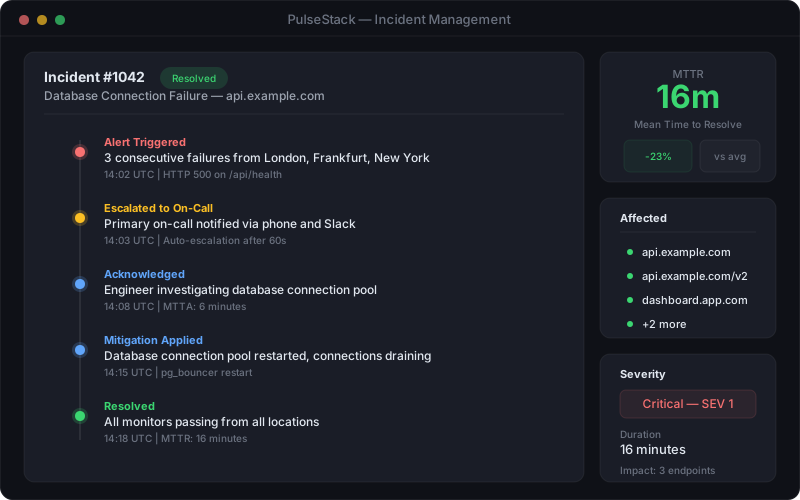
PulseStack incident timeline showing a failed deployment detected, alerted, rolled back and resolved within minutes
An incident timeline lines up the deploy, the first failed check, the alert and the rollback, so the cost of a bad release is measured in minutes

If your team already struggles with noisy notifications, the principles in our guide to avoiding alert fatigue apply directly: alert on symptoms users feel, confirm before you page, and make every alert actionable.

Turning Monitoring Signals Into Rollback Triggers

The value of deployment monitoring comes from what you do with it. A rollback that happens three minutes after a bad deploy is a minor blip; one that happens forty minutes later, after a customer complaint, is an incident. The difference is almost always whether the team agreed on rollback criteria in advance.

Write down, before the deploy, the conditions under which you will roll back without further discussion. Good rollback triggers are specific, measurable and tied to user impact. For example:

  • Any critical journey (homepage, login, checkout, key API) fails external checks from two or more locations for two consecutive checks.
  • The share of 5xx responses rises above an agreed level, such as one percent, for more than a few minutes.
  • Median or 95th percentile response time is more than double its baseline for more than five minutes after the rollout completes.
  • A content check on a key page fails, meaning the page returns 200 but is missing expected text.
  • A scheduled job or queue worker misses its heartbeat after the release.
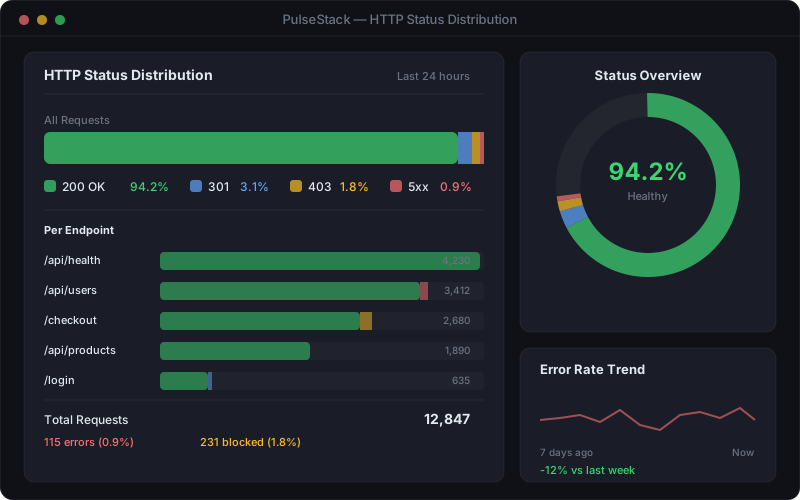
PulseStack HTTP status breakdown showing the share of 2xx, 4xx and 5xx responses before and after a release
Comparing the status code mix before and after a release shows at a glance whether the new version introduced errors

For canary releases, apply the same criteria to the canary group and compare it directly with the stable version. The canary does not need to be perfect; it needs to be no worse than what is already running. For blue-green deployments, keep the old environment intact and ready until the post-release watch window has passed cleanly, so that rolling back is a traffic switch rather than a rebuild.

Finally, rehearse the rollback. A rollback path that has never been exercised is a hypothesis. Teams that practise it regularly, and measure how long it takes, tend to recover far faster when it counts. Tracking that time over many releases is one of the most direct ways to improve your mean time to recovery.

A Practical Deployment Monitoring Checklist

If you want to start proving that your releases are genuinely zero downtime, this checklist covers the essentials:

  1. Baseline your key endpoints for a week: availability, response time at the median and 95th percentile, and status code mix.
  2. Add external checks on every critical journey, not just the homepage, at a one minute interval or shorter.
  3. Add content checks that look for a known phrase on key pages, so a blank page returning 200 is caught.
  4. Add heartbeats for workers and scheduled jobs so broken background processing is visible.
  5. Check from multiple locations and require confirmation before alerting.
  6. Make health checks honest: readiness should mean the instance can reach its dependencies, not just that the process started.
  7. Agree rollback triggers before each release and keep the previous version ready until the watch window passes.
  8. Review deploy windows weekly. Look for small, repeated blips across releases; they are the clearest sign that draining, warm-up or health checks need work.

None of this requires a complex observability platform. It requires continuous, external measurement of what users experience, and the discipline to compare every release against a known baseline. Once that is in place, "zero downtime" stops being a feature of your deployment tool and becomes a number you can report.

PulseStack provides HTTP, API, keyword, SSL certificate, DNS record and heartbeat monitoring with multi-location confirmation, automatic re-checks and eight alert channels, so you can watch every release from the outside in. See the full list of features, or compare plans on the pricing page and start with a free trial.

Start monitoring your infrastructure today

25 free monitors, no credit card needed. Set up in under 30 seconds.

Get started free