Mean Time to Recovery (MTTR): How to Measure and Improve
Why MTTR Is the Metric That Matters Most
Every online service will fail eventually. Hardware dies, deployments go wrong, upstream providers have bad days, and traffic spikes overwhelm capacity you thought was generous. Perfect reliability is a fantasy, which is why the mature question is not "how do we never go down?" but "when we do go down, how fast do we recover?" That question has a name: Mean Time to Recovery, or MTTR.
MTTR is the single most actionable reliability metric a team can track. Availability tells you whether you are meeting your targets; MTTR tells you why, and it points directly at what to fix. Two teams can both suffer ten incidents a month, but the team that recovers in eight minutes delivers a radically better experience than the team that takes two hours. The frequency of failure is often outside your control. The speed of recovery almost never is.
This guide explains exactly what MTTR measures, how to calculate it correctly, what a realistic target looks like, and the concrete practices that shrink it. Whether you run a two-person startup or an established engineering organisation, reducing MTTR is one of the highest-leverage investments you can make: it improves customer experience, protects revenue, and reduces the human cost of being on call. The foundation for all of it is fast, reliable detection through continuous website monitoring, because you cannot recover from an incident you have not yet noticed.
What MTTR Actually Measures
MTTR is deceptively simple on the surface: it is the average time it takes to recover from a failure. The complication is that "MTTR" is used loosely to mean at least four different things, and teams routinely talk past each other because they are measuring different intervals. Precision here matters.
The acronym MTTR expands to any of the following, and each measures a genuinely different thing:
Mean Time to Recovery: from the moment an incident begins to the moment full service is restored. This is the customer-facing definition and the one most worth optimising.
Mean Time to Repair: the time spent actively fixing the problem, excluding the delay before anyone started work. Useful for measuring the efficiency of the fix itself.
Mean Time to Resolve: recovery plus any follow-up work needed to prevent recurrence, so it extends past the point service came back.
Mean Time to Respond: from alert to the start of remediation, isolating how quickly a human engages.
Because the term is ambiguous, the discipline is to define which interval you mean and measure it consistently. Most teams should standardise on Mean Time to Recovery (the full user-visible outage duration) because that is what customers actually experience and what your SLAs and SLOs are ultimately judged against.
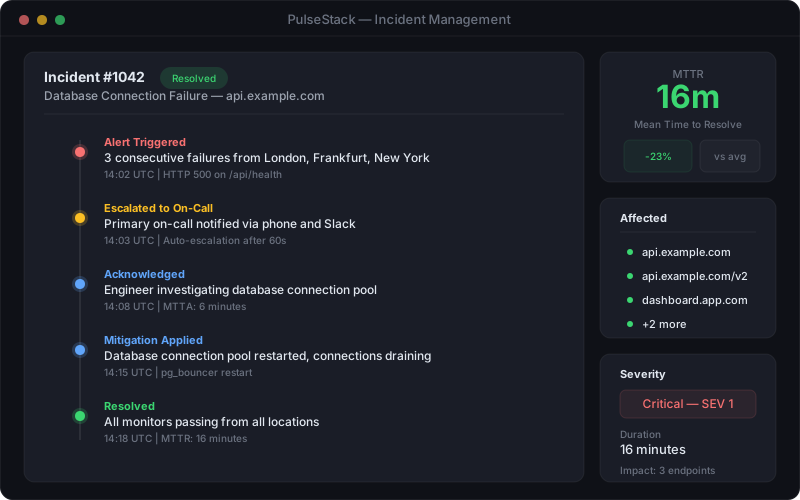
An incident timeline breaks a single outage into measurable phases, each one an opportunity to shave minutes off total recovery time
The Wider Family of Incident Metrics
MTTR does not live alone. It sits inside a small family of related "mean time" metrics, and understanding the neighbours makes MTTR far more useful:
MTTD (Mean Time to Detect): how long a problem exists before anyone or anything notices it. This is where most wasted recovery time hides.
MTTA (Mean Time to Acknowledge): how long between an alert firing and an engineer picking it up. High MTTA usually signals alert fatigue or a broken on-call rotation.
MTBF (Mean Time Between Failures): the average uptime between incidents, a measure of how often things break rather than how fast you fix them.
Together these decompose the full lifecycle of an incident. If your MTTR is poor, breaking it down into detect, acknowledge, and repair almost always reveals which phase is the real bottleneck, and it is far more often detection than the fix itself.
How to Calculate MTTR
The calculation itself is straightforward. MTTR is the total time spent recovering from incidents over a period, divided by the number of incidents in that period:
MTTR = total downtime across all incidents / number of incidents
Suppose that over a month you had five incidents with recovery times of 12, 45, 8, 90, and 25 minutes. The total is 180 minutes across 5 incidents, giving an MTTR of 36 minutes. Simple arithmetic; but the value is only as good as the data feeding it, and that is where teams go wrong.
Getting the Timestamps Right
An accurate MTTR depends on capturing two moments precisely for every incident: when the failure actually began (not when you noticed it) and when service was genuinely restored (not when someone thought it might be fixed). Both are easy to get wrong:
If you record the incident start as the moment the alert fired rather than when the outage truly began, you are silently excluding your entire detection delay and flattering your numbers.
If you mark recovery when the fix was deployed rather than when metrics confirmed the service was healthy again, you understate the tail end of the incident.
This is precisely why external, independent monitoring is the credible source of truth for MTTR. A monitor checking your service every 30 seconds from multiple locations timestamps the exact moment checks started failing and the exact moment they started passing again, objective bookends that internal, self-reported data cannot match. Feeding MTTR from that data removes the temptation to round in your own favour.
Averages Hide the Ugly Incidents
A plain average is a blunt instrument. In the example above, four incidents were resolved quickly and one 90-minute outage dominated the total. If you only watch the average, you miss that one category of failure is catastrophically slow to resolve. Track the distribution alongside the mean, the median (p50) and the worst case (p95 or p99), so a single monster incident does not get buried, and so a run of small blips does not mask a systemic slow-recovery problem.
What Drives MTTR: The Incident Lifecycle
To improve MTTR you have to understand where the time actually goes. Total recovery time is the sum of several distinct phases, and each has completely different levers. Break a typical incident into its stages:
Detection: the gap between the failure occurring and your systems noticing. Determined by check frequency and coverage.
Alerting: routing the detection to the right person through the right channel.
Acknowledgement: a human engaging with the alert and taking ownership.
Diagnosis: understanding what is actually broken. Usually the longest and most variable phase.
Repair: applying the fix, whether a rollback, a restart, a config change, or a failover.
Verification: confirming through real signals that service is genuinely restored.
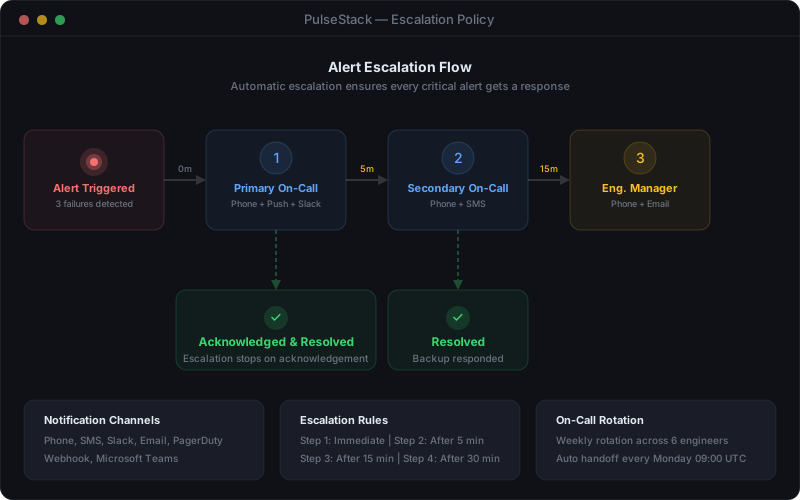
A well-designed escalation flow compresses the acknowledgement phase: if the first responder does not engage within minutes, the alert automatically climbs to the next person
The revealing exercise is to instrument each phase separately for real incidents and see where the minutes accumulate. The results are almost always counterintuitive. Teams assume the repair is the slow part, but far more often the damage is done in detection and diagnosis. An outage that a customer reported by email 40 minutes in, that took another 10 minutes to route to the right engineer, and was then fixed in 5 minutes, is a detection and alerting problem masquerading as a 55-minute incident. The fix was never the issue.
This is the core insight behind reducing MTTR: attack the phases that consume the most time, not the ones that feel most technical. For most teams, the biggest single win is collapsing detection time from minutes or hours down to seconds, which is entirely a function of how well you monitor. Robust incident management depends first on knowing there is an incident at all.
Benchmarks: What Is a Good MTTR?
The inevitable question is: what number should we be aiming for? The honest answer is that MTTR benchmarks vary enormously by industry, system complexity, and the criticality of the service. A blog and a payments platform live in different universes. That said, some useful reference points exist.
Elite-performing engineering organisations, the kind measured in industry research on software delivery performance, restore service in under one hour for the large majority of incidents, and the very best operate in the minutes range for common failure classes. Mid-tier teams typically sit somewhere between one hour and a day. Teams without mature monitoring and response practices routinely measure MTTR in hours or even days, often because detection alone eats most of that time.
Rather than chasing someone else's number, anchor your target to what your business actually requires:
Revenue-critical systems (checkout, payments, core APIs) warrant the tightest MTTR you can achieve, because every minute maps directly to lost revenue and eroded trust.
Customer-facing but non-transactional systems (marketing sites, dashboards, documentation) tolerate a looser target.
Internal tooling: important, but rarely justifies the same investment as customer-facing paths.
The most productive way to use benchmarks is not as a pass/fail grade but as a direction of travel. Measure your current MTTR honestly, set a target that is meaningfully better, and track the trend month over month. A team that halves its MTTR over two quarters is winning regardless of where it started. Absolute numbers matter far less than the slope of the line.
How to Improve MTTR
Reducing MTTR is not a single project; it is a set of compounding improvements across the incident lifecycle. Here are the strategies with the highest return, ordered roughly by impact for most teams.
1. Detect Faster: the Biggest Lever
Since detection so often dominates recovery time, shortening it delivers the largest gains for the least effort. Move from waiting for customers to report problems to catching them automatically within seconds. That means frequent checks (every 30 seconds, not every 5 minutes), coverage of the journeys that matter rather than just the homepage, and multi-location monitoring so a regional outage is not invisible to a single probe. Monitoring beyond simple uptime, covering response time degradation, HTTP error rates, SSL and certificate health, catches problems in the grey zone before they become full outages.
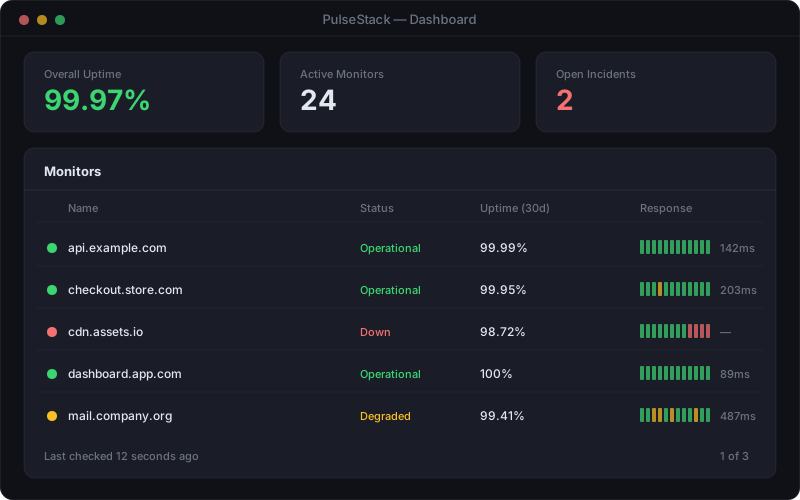
A live monitoring dashboard collapses detection time to near zero, surfacing degradation and failures the instant they appear rather than when a customer complains
2. Route Alerts Intelligently
An alert that reaches the wrong person, or that drowns in noise, adds dead time to every incident. Send high-signal alerts to the right on-call engineer through channels they actually watch, and build automatic escalation so an unacknowledged alert climbs to the next responder rather than sitting idle. Just as important, ruthlessly suppress low-value noise: teams suffering from alert fatigue acknowledge slowly precisely because most alerts have taught them not to trust the pager.
3. Write Runbooks for Common Failures
Diagnosis is the most variable phase, and the fastest way to compress it is to not start from scratch. For every recurring failure class, maintain a runbook: the symptoms, the likely causes, the diagnostic steps, and the known fix. A responder following a good runbook resolves in minutes what an unprepared one might take an hour to puzzle out under pressure. Link runbooks directly from the alerts that trigger them.
4. Make Rollback and Failover Trivial
A large share of incidents are caused by deployments. If your fastest path to recovery is a one-command rollback or an automated failover, the repair phase collapses. Invest in the ability to reverse a bad change instantly: it is almost always faster and safer than diagnosing and hot-fixing a broken release while users suffer.
5. Run Blameless Post-Incident Reviews
Every incident is a paid lesson; the question is whether you collect on it. A blameless post-incident review that asks "what made this slow to recover?" and turns each answer into a concrete action, whether a new monitor, a better runbook, or an automated failover, is how MTTR trends downward over time. Track whether the same failure class recurs; if it does, the review is not producing real fixes.
6. Practise
Teams that rehearse incident response recover faster during real ones. Game days and controlled failure injection expose gaps in monitoring, alerting, and runbooks while the stakes are low. The muscle memory built in practice is what keeps a 2am incident from becoming a two-hour scramble.
Common MTTR Pitfalls to Avoid
MTTR is a powerful metric, but it is easy to measure in ways that mislead or to optimise in ways that backfire. Watch for these traps.
Gaming the start time. Recording incident start at alert time rather than actual failure time quietly deletes your detection delay from the metric. Your MTTR looks great while customers experience something entirely different. Always anchor the start to when the outage genuinely began, ideally from independent monitoring data.
Optimising the average while ignoring the tail. A handful of catastrophic long incidents can be the entire story, hidden behind a reassuring mean. Watch the p95 and worst case, not just the average.
Chasing MTTR at the expense of quality. Pressure to close incidents fast can encourage superficial fixes that paper over the symptom and guarantee a recurrence. Recovery means the underlying failure is genuinely resolved, not that the alert stopped firing.
Too few incidents to be meaningful. If you only have two or three incidents in a period, the "mean" is statistically meaningless: one outlier swings it wildly. Look at longer windows and treat small samples with appropriate scepticism.
Measuring MTTR without MTTD. MTTR in isolation cannot tell you whether your problem is slow detection or slow repair. Always decompose it. Nine times out of ten the surprise is how much time detection consumed.
Treating MTTR as a scoreboard for blame. The moment MTTR becomes a stick to beat engineers with, people start hiding incidents and gaming timestamps, and the data becomes worthless. It is a system-health signal, not a performance review.
Used honestly, MTTR is the metric that turns reliability from an aspiration into an engineering discipline. It tells you not just that you failed, but exactly where the time went and what to fix next. The first and largest improvement is nearly always the same: detect faster. You cannot recover from what you have not noticed, so credible, fast, multi-location detection is the foundation everything else builds on. Explore how PulseStack's monitoring features shorten detection to seconds, and see the plans that fit your stack, because the fastest recovery starts the instant something breaks.
Start monitoring your infrastructure today
50 free monitors, no credit card needed. Set up in under 30 seconds.