Guide22 September 2026· 10 min read

Port Monitoring: How to Detect Service Failures Before Your Users Do

The Failures HTTP Checks Never See

Most monitoring starts with a web page. You point an uptime checker at your homepage, it requests the URL every minute, and it tells you when the response stops being a 200. That covers a lot of ground, and for many small sites it is enough.

But a modern application is not one service. Behind the homepage sit a database, a cache, a message queue, a mail server, a search cluster, perhaps an SFTP endpoint for a partner integration or a game server on a custom port. None of these speak HTTP. None of them have a page to load. And many of them can fail while the homepage carries on returning a perfectly healthy 200, because the homepage is cached, or because the page that breaks is the checkout, the login, or the background job that sends receipts.

Consider a few common examples. The mail server stops listening on port 587, and password reset emails quietly stop arriving. Redis on port 6379 falls over, so sessions and rate limits break in odd, intermittent ways. The message broker on port 5672 stops accepting connections, jobs pile up in memory, and nothing is processed for hours. In each case the website looks fine to a basic check, while customers experience something between mild annoyance and a complete outage.

Port monitoring closes that gap. Instead of asking whether a web page loads, it asks a simpler and more fundamental question: is the service on this host and port accepting connections right now? This guide explains how that check works, which ports are worth watching, how to read the results, and how to configure it so that it catches real failures without flooding you with noise.
How a TCP Port Check Actually Works

Almost every service you care about runs over TCP, and every TCP conversation begins with the same three step handshake. The client sends a SYN packet to the target port. If a service is listening, the server replies with SYN-ACK. The client completes the exchange with an ACK, and the connection is open. A port monitor performs exactly this handshake on a schedule, records whether it succeeded and how long it took, and then closes the connection cleanly.

That sounds trivial, but the handshake carries a surprising amount of information, because there are three distinct ways it can end:

  • Connection accepted. Something is listening on that port and the operating system accepted the connection. The service process is running and bound to the port, the host is up, and the network path between the checker and the host is open.
  • Connection refused. The host answered, but with a reset (RST) rather than a SYN-ACK. The machine is up and reachable, but nothing is listening on that port. This almost always means the service has crashed, failed to start after a reboot, or was restarted with a different configuration.
  • Connection timed out. Nothing came back at all. The host may be down, a firewall or security group may be silently dropping packets, a routing problem may be sitting somewhere between the checker and your network, or the server may be so overloaded it cannot respond within the timeout.

The distinction between refused and timed out is one of the most useful diagnostic signals in infrastructure monitoring. A refusal points you straight at the service process. A timeout points you at the host, the network, or the firewall. Knowing which one you are dealing with before you open a terminal saves real minutes during an incident.

Alongside the result, a good port monitor records the connection time in milliseconds. The handshake time is a clean measure of network latency plus how quickly the host can accept work, without any application logic in the way. A port that normally connects in 20 milliseconds and is now taking 900 is telling you something, even though it is still technically up.

It is worth being clear about what a port check does not prove. An accepted connection means a process is listening; it does not guarantee that the process is healthy. A database can accept TCP connections while every query hangs on a lock, and a web server can complete the handshake and then return a 500 for every request. Port monitoring is a foundation layer, not a complete health check, which is why it works best alongside HTTP monitoring and application level checks rather than instead of them.

Which Ports Are Worth Monitoring

You do not need to monitor every open port on every machine. The goal is to watch the services whose failure would affect customers or block the rest of your system. For most teams that list looks something like this:

  • Databases: PostgreSQL on 5432, MySQL and MariaDB on 3306, MongoDB on 27017, Microsoft SQL Server on 1433. If the primary database stops accepting connections, almost everything else fails with it.
  • Caches and in-memory stores: Redis on 6379 and Memcached on 11211. Cache failures often produce strange, partial symptoms such as users being logged out, rate limits misbehaving, or pages suddenly becoming very slow.
  • Message queues and brokers: RabbitMQ on 5672, Kafka on 9092, NATS on 4222. A dead broker rarely produces errors on the website; it produces silence, as orders stop being fulfilled and emails stop being sent.
  • Mail: SMTP on 25, 465 and 587, IMAP on 993, POP3 on 995. Transactional email failures are among the hardest to notice, because the people affected are waiting for something that never arrives and usually do not tell you.
  • Remote access and file transfer: SSH on 22, SFTP (which also runs on 22), FTP on 21. Losing SSH during an incident is the worst possible time to find out it was broken.
  • Search and data services: Elasticsearch and OpenSearch on 9200, LDAP on 389 and 636, DNS over TCP on 53.
  • Custom services: game servers, streaming endpoints, IoT gateways, and in-house TCP protocols running on non-standard ports. These are often the most important to monitor, because nothing else in a typical monitoring stack will ever look at them.
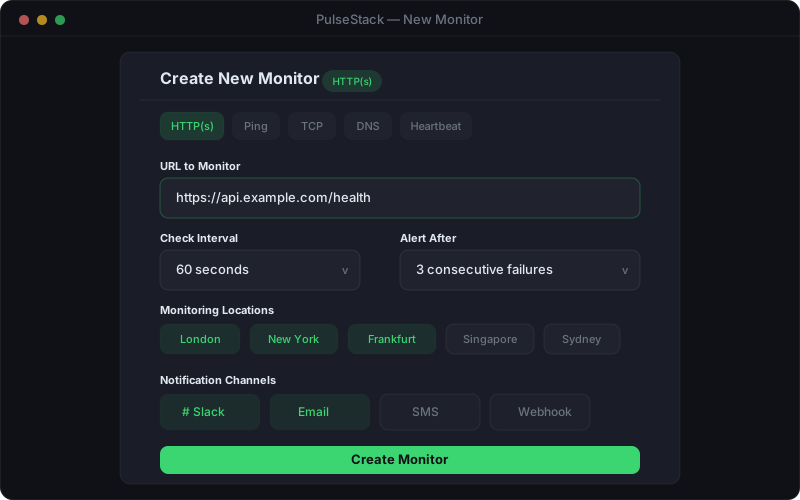
PulseStack monitor configuration screen showing a TCP port monitor being set up with host, port, check interval and alert settings
A port monitor needs only a host, a port and an interval to start protecting a service

A useful exercise is to draw the path a single customer request takes through your system and note every network hop that is not HTTP. Each of those hops is a dependency that can fail independently, and each one is a candidate for a port monitor. If a service appears in your architecture diagram but not in your monitoring, that is a gap worth closing.

The same thinking applies to services you do not run yourself. A payment gateway, an external SMTP relay, or a partner's SFTP server can all be checked from outside. You cannot fix them, but knowing within a minute that the problem is theirs rather than yours changes how you respond. We cover that approach in more depth in our guide to third-party dependency monitoring.

Monitoring Internal Services Without Exposing Them

There is an obvious tension here. The services most worth monitoring, such as databases, caches and brokers, are exactly the ones that should never be reachable from the public internet. Opening PostgreSQL to the world so that an external checker can connect to it would be a far bigger risk than the outage you are trying to detect.

There are several sensible ways to resolve this:

  • Allowlist the monitoring source addresses. If your monitoring provider publishes the IP ranges its checks come from, you can permit only those addresses through the firewall or security group for the specific port being monitored. The port stays closed to everyone else.
  • Monitor a public facing proxy for the service. Where a service sits behind a load balancer, connection pooler or bastion host, checking that front door gives you most of the value without exposing the backend directly.
  • Pair external checks with heartbeats. For purely internal systems, a small scheduled job inside your network can test the service locally and then report in to a heartbeat URL. If the job stops reporting, or reports failure, you are alerted. This is the same pattern used for cron job monitoring, and it works without opening any inbound ports at all.
  • Use a private network or VPN path if your monitoring setup supports agents inside your infrastructure, so checks originate from a trusted location.

It is also worth thinking about the reverse case. Some teams keep a short list of ports that should always be closed from the outside, such as database and admin ports, and periodically confirm that they are. A database port that suddenly becomes publicly reachable after a firewall change is a security incident, not an availability one, but it is detected with the same basic technique.

Choosing Check Intervals and Failure Thresholds

Two settings determine how useful a port monitor is in practice: how often it checks, and how many failures it tolerates before raising an alarm. Get them wrong in one direction and you miss short outages; get them wrong in the other and your team learns to ignore the alerts.

Check interval. For customer facing and business critical services, a one minute interval is a sensible default. It means the worst case gap between a failure and the first failed check is sixty seconds, which is fast enough for almost any incident process. Services where every second matters, such as a primary database or a payment path, can justify shorter intervals where your plan allows it. Supporting services such as a backup SFTP endpoint or an internal search cluster can often run at five minutes without losing much.

Timeout. A TCP handshake to a healthy host completes in tens of milliseconds, even across continents. A timeout of a few seconds is generous enough to absorb brief network jitter while still treating a genuinely unresponsive host as down. Very long timeouts mainly delay the moment you find out.

Consecutive failure threshold. A single failed handshake is not an outage. Packets get dropped, routes flap, and a busy host occasionally misses one connection. Requiring two or three consecutive failures before alerting filters out almost all of that noise while adding only a minute or two of detection time. For flaky networks or distant hosts, three is usually the sweet spot; for services where a single missed connection is meaningful, two is reasonable.

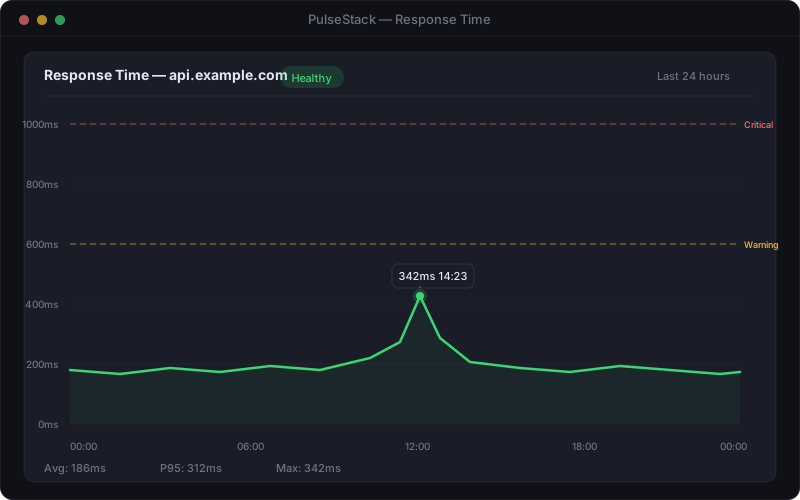
Response time chart showing connection times over a day with warning and critical threshold lines
Watching connection time trends reveals a struggling service well before its port stops answering entirely

Latency thresholds. Because every check records connection time, it is worth deciding what "too slow" looks like for each service. Establish a baseline over a week, then set a warning somewhere around three to five times the normal connection time. A slowly climbing handshake time is often the first visible sign of connection pool exhaustion, a host running out of memory, or a network path degrading. Our guide to setting response time thresholds covers how to pick values that are meaningful rather than arbitrary.

Multi-Location Checks and Alert Routing

A port check run from a single location can only tell you that that location cannot reach your service. If the problem is a routing issue at one network provider, a regional outage at a cloud edge, or a firewall rule that only affects certain source ranges, a single checker will report a global outage that is actually local. Worse, it will wake someone at three in the morning to investigate it.

Checking the same port from several geographic locations solves this. When one location fails and the others succeed, you are looking at a network path problem rather than a dead service. When every location fails at once, the service really is down. Requiring confirmation from more than one location before declaring an outage is one of the most effective ways to cut false alarms, and it also gives you useful evidence when talking to a hosting provider about a regional problem. We explain the approach in detail in our article on multi-location monitoring.

Once a failure is confirmed, the alert needs to reach the right person. Port failures on core infrastructure usually deserve an immediate page to whoever is on call. Failures on supporting services can often go to a team chat channel during working hours instead. Routing every port alert to everyone is a fast route to alert fatigue, so it is worth deciding in advance which services justify waking somebody up and which can wait until morning.

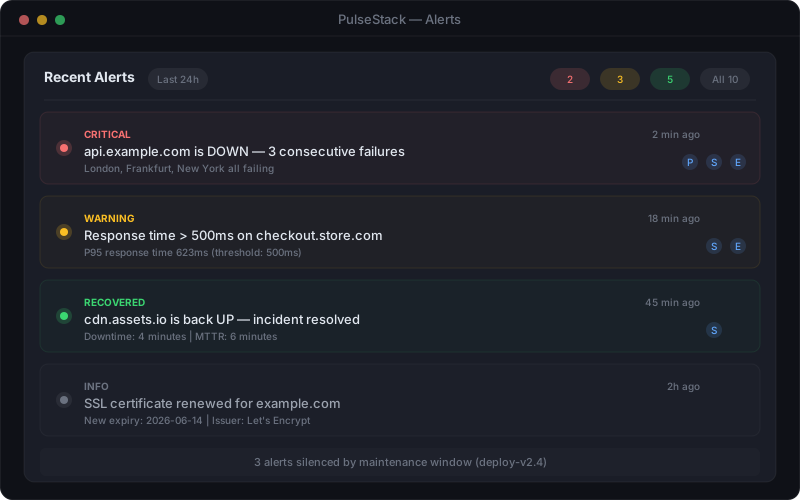
PulseStack alert notification panel showing port down and recovery alerts routed to Slack, email and on-call channels
Route critical port failures to on-call and lower priority services to team channels

Two other features make a real difference day to day. Maintenance windows let you mute alerts during planned work, so that restarting a database for an upgrade does not page anybody. And recovery notifications tell you when a port starts accepting connections again, which closes the loop on an incident and gives you an accurate record of how long it lasted. The alert fatigue guide has more on building a notification setup your team will trust.

Reading the Results During an Incident

When a port monitor fires, the pattern of results usually points you toward the cause before you have even logged in. A few patterns come up again and again:

  • Refused everywhere, suddenly. The service process has stopped. Check whether it crashed, ran out of memory and was killed, or failed to restart after a deployment or reboot. Service logs and the system journal are the first place to look.
  • Timed out everywhere, suddenly. The host itself is likely down or unreachable, or a firewall rule has changed. Check whether other ports on the same host are also failing; if SSH is down too, it is the machine or the network, not the service.
  • Timed out from one location only. A network path problem between that region and your host. Usually transient, and usually outside your control, but worth recording.
  • Intermittent failures with rising connection times. The service is struggling under load. Connection pools, file descriptor limits, CPU saturation and memory pressure are the usual suspects.
  • Everything green but customers are reporting errors. The port is open but the application behind it is unhealthy. This is the limit of port monitoring, and the moment to lean on HTTP, API and keyword checks that test real behaviour.

Keeping a history of these events is valuable in its own right. A service that has been refused three times in a month after nightly jobs run is telling you about a memory leak or a resource limit long before it causes a major incident. Reviewing port incident history as part of a regular post-incident review turns individual blips into patterns you can actually fix.

Getting Started With Port Monitoring

Setting up useful port monitoring takes less time than most teams expect. A practical first pass looks like this:

  1. List your non-HTTP dependencies. Databases, caches, queues, mail, SSH and any custom services. Include third parties you rely on.
  2. Decide how each one will be reached. Public services can be checked directly; internal ones need an allowlist, a proxy, or a heartbeat.
  3. Set intervals by criticality. One minute for anything customer facing, longer for supporting services.
  4. Require two or three consecutive failures and confirmation from more than one location before alerting.
  5. Route alerts by severity, with core infrastructure paging on-call and everything else going to a team channel.
  6. Baseline connection times for a week, then add latency warnings so that degradation is visible before failure.

Port monitoring is not glamorous. It will not tell you about slow queries, broken JavaScript or a checkout bug. What it does, very reliably, is tell you the moment a service your business depends on stops answering, and whether the cause is the service, the host or the network. That makes it one of the cheapest and most effective layers you can add to a monitoring stack.

PulseStack includes port monitoring and TCP monitoring alongside HTTP, API, SSL certificate, DNS record, domain expiry, keyword and heartbeat checks. Failed checks are re-tested automatically, a monitor is only marked down when at least two of its three check locations fail, and alerts go out through eight channels. You can compare what each plan includes on the pricing page and start with a free trial.

Start monitoring your infrastructure today

25 free monitors, no credit card needed. Set up in under 30 seconds.

Get started free