Guide24 August 2026· 11 min read

Black Friday and High Traffic Event Monitoring: A Practical Playbook

Why Peak Events Break Sites That Are Otherwise Fine

A website that has run happily for eleven months can fall over in the first ninety seconds of a sale. That is not bad luck and it is rarely a single broken component. It is the fact that a traffic spike does not scale a site's problems linearly: it finds every place where something is shared, queued, rate limited, or cached badly, and it finds them all at once.

The pattern is remarkably consistent. Traffic climbs. Response times creep up in a way nobody notices because they are still comfortably under any alert threshold. A connection pool saturates. Requests start queueing rather than failing, so the monitoring still reports the site as up. Then the queue reaches a timeout somewhere upstream, and the site goes from slow to unavailable in the space of a minute, with no useful warning in between.

What makes peak events particularly punishing is the cost profile. An hour of downtime on a Tuesday in March is annoying. An hour of downtime during a Black Friday promotion you have spent a quarter's marketing budget driving traffic to is a different kind of number, and it is compounded by the fact that the traffic does not come back later. Customers who cannot check out during a sale buy from somebody else, and the true cost of that downtime includes the paid media you burned pushing people to a page that would not load.

The good news is that peak events are the most predictable failure scenario a team will ever face. You know the date. You have a reasonable idea of the traffic multiple. You can rehearse. This playbook covers what to do in the weeks before, during, and after any high traffic event, whether that is Black Friday, a product launch, a ticket on-sale, a TV appearance, or a viral moment you half expected.
Four Weeks Out: Establish a Baseline You Can Trust

You cannot spot abnormal behaviour during a peak if you never recorded what normal looks like. The single most valuable preparation task is unglamorous: make sure you have four to six weeks of continuous monitoring data before the event, covering response time as well as availability.

Baseline the things that will matter under load, not just the homepage:

  • Response time percentiles for the homepage, a category or listing page, a product or detail page, the basket, and the checkout. Record the median and the 95th percentile separately, because the average will hide exactly the behaviour you need to see.
  • Time of day and day of week variation. Most sites already have a daily peak. Knowing that yours runs 40 percent slower at 8pm is important context when you are reading a graph at 8pm on the day.
  • Third party call timings where you can measure them: payment provider, search, reviews, tag manager, personalisation.
  • Error rate at rest. Almost every site has a low background rate of 500s. If you do not know that yours is 0.05 percent, you cannot tell whether 0.4 percent on the day is a crisis or a rounding error.
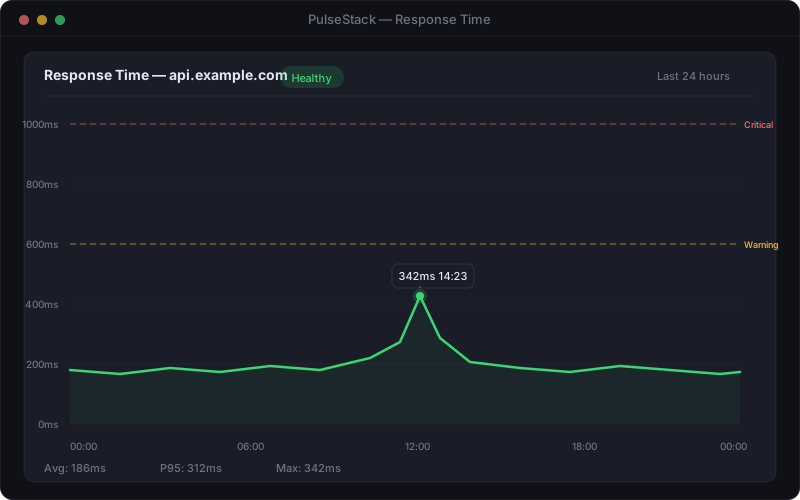
PulseStack response time chart showing a baseline period with median and percentile lines against warning and critical thresholds ahead of a peak traffic event
Weeks of baseline data turn peak day monitoring from guesswork into comparison

With the baseline in hand, set provisional thresholds now rather than on the morning of the event. A useful starting point is to warn at roughly 1.5 times your normal 95th percentile and treat 3 times as critical, then adjust once you see how the site behaves under a load test. The guide to setting response time thresholds explains why percentiles are the right unit for this and how to avoid thresholds that either never fire or never stop.

This is also the point to run a load test, and to run it against something that resembles production. A load test that only hits cached pages proves that your cache works. The interesting question is what happens to the uncached path: basket, checkout, login, search, and anything that writes to the database. Run the test with monitoring active so you can see which signal moves first. That signal is your early warning system on the day.

Two Weeks Out: Expand Coverage to the Whole Revenue Path

Most of the year you can get away with monitoring a handful of pages. For a peak event, monitor every step a customer takes between arriving and paying, because a failure anywhere in that chain costs the same as a failure at the front door.

A workable coverage list for a retail-style event:

  1. Homepage and the campaign landing page. The landing page is frequently new, frequently built in a hurry, and frequently the only page your paid traffic sees.
  2. Category or collection pages, including any that will be created specially for the sale.
  3. A product or detail page, with a content assertion on the price and the add to basket control, so a page that renders without stock or pricing data still fails the check.
  4. Add to basket and the basket page.
  5. Checkout, monitored as a multi-step transaction where your tooling supports it rather than a single page fetch.
  6. Login and account creation, which see a disproportionate spike during sales and are often backed by the slowest queries on the site.
  7. Search, if the site has it, which is usually the first thing to buckle under load.
  8. The APIs behind all of the above, monitored directly rather than only through the pages that consume them.
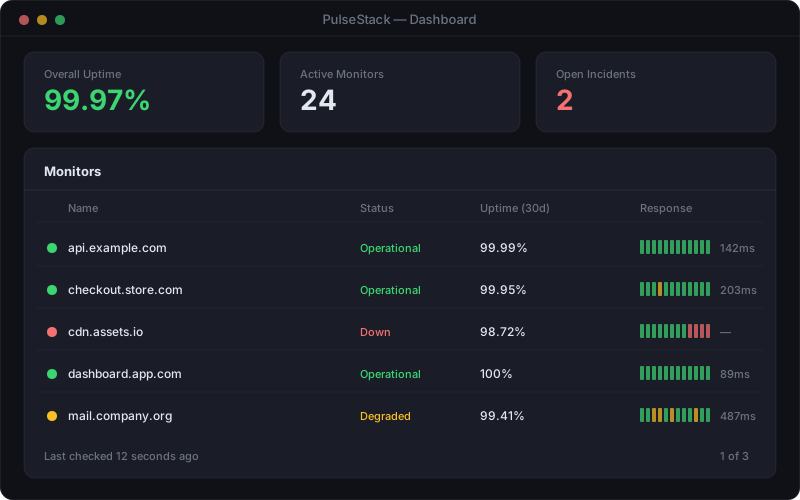
PulseStack uptime dashboard showing multiple monitors across a checkout journey with status, response time, and recent check history
Monitoring the whole revenue path, not just the homepage, so a broken basket cannot pass as a healthy site

Add content assertions everywhere, not just status code checks. Under load, the most expensive failures are the ones that return a perfectly valid 200: a product page with no price because the pricing service timed out, a basket that renders empty, a checkout that shows the form but has quietly lost its payment iframe. The guide to e-commerce monitoring goes through the specific failure modes in each of these steps.

Check from more than one location as well. Peak traffic often exposes CDN and regional routing problems that simply do not exist at normal volume, and a single monitoring location will report the site as perfectly healthy while an entire region cannot reach it. Multi-location monitoring is the difference between finding that out from your dashboard and finding it out from social media.

Finally, verify the boring expiry items now and never again during peak week: certificates on every hostname including the campaign subdomain, the domain registration itself, and any API credentials or tokens that rotate. A certificate that expires on the morning of the sale is a genuinely avoidable catastrophe, and certificate monitoring gives weeks of notice to anyone who bothers to switch it on.

Peak Week: Retune Intervals, Thresholds, and Escalation

The monitoring configuration that suits a normal month is deliberately conservative, because nobody wants to be paged for noise. For a few days around a peak event you want the opposite trade: faster detection, tighter thresholds, and an escalation path with a human on the end of it.

Changes worth making, and worth diarising to reverse afterwards:

  • Drop check intervals to one minute on the revenue path. During a sale, five minutes of undetected downtime is a meaningful amount of money.
  • Tighten response time warnings to the level where they give you time to act rather than confirming what already happened. If your critical threshold is the point at which customers abandon, your warning threshold needs to be well below it.
  • Keep the two-failure confirmation rule for outage alerts. Faster checking makes false positives more likely, not less, and paging on a single failed check during a busy period is how a war room loses trust in its own dashboard by lunchtime.
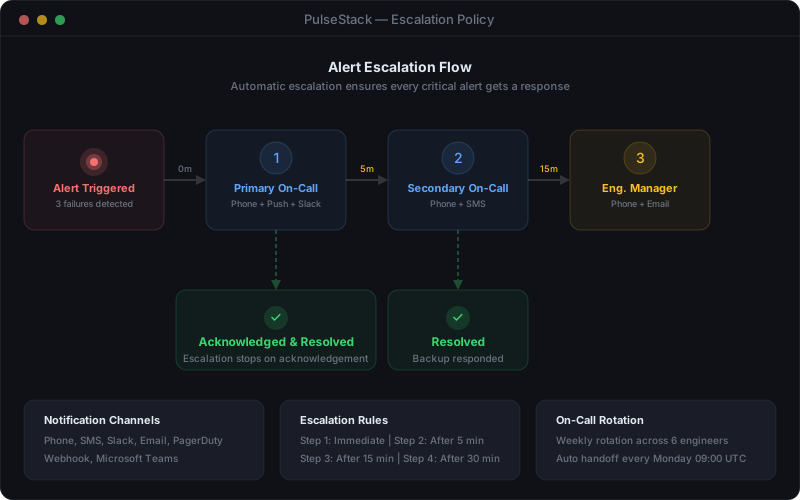
  • Split routing by severity. Availability failures on the revenue path go to phones. Slow response warnings go to the shared channel where somebody is already watching. Everything else waits.
  • Name a single owner per shift. Not a rota, not a team alias: one person who is definitely looking, with a named second person who is definitely reachable.
PulseStack alert escalation flow showing severity based routing from monitor failure through on-call acknowledgement to secondary escalation
Peak week escalation: revenue path failures reach a phone, everything else reaches a channel

The risk in all of this is obvious. Tighter thresholds plus faster checks equals more alerts, and a war room that is being pinged every four minutes stops reading the alerts within an hour. Guard against it deliberately: group related alerts so one incident produces one notification rather than fourteen, suppress downstream monitors when an upstream dependency is already known to be failing, and give somebody explicit permission to mute a monitor that is provably noisy. The piece on alert fatigue covers the mechanics, and peak week is precisely when the cost of ignoring it is highest.

One more thing to settle before the event rather than during it: the change freeze. Agree the date when deployments stop, agree what qualifies as an exception, and make sure everyone including marketing and merchandising knows that a "small content change" to a template counts as a deployment. A surprising proportion of peak day incidents are self-inflicted.

Dependencies: The Failures That Are Not Yours

On a normal day your site depends on a payment provider, a CDN, a DNS provider, a search service, an email sender, an analytics stack, and probably a dozen marketing tags. On a peak day, so does everybody else's, and shared infrastructure has a habit of getting busy at the same time you do.

Two failure modes matter here, and they need different responses.

The dependency goes down. This is the easy case, in the sense that it is at least obvious. Your payment provider returns errors, your checkout stops completing, and everyone knows within minutes. The preparation is a fallback plan agreed in advance: a second payment method you can enable, a queue you can hold orders in, or at minimum a message you can put in front of customers that does not make them think the fault is theirs.

The dependency gets slow. This is the case that actually causes the outage, and it rarely appears on anybody's status page. A third party API that normally answers in 80ms starts taking four seconds. Your application waits, because that is what a default timeout tells it to do. Your worker threads fill with requests that are doing nothing but waiting, and a slow supplier becomes a total outage on your side. Aggressive timeouts and a circuit breaker are the technical answer; monitoring the dependency directly, rather than trusting its status page, is how you know which supplier to blame while it is happening. The guide to third-party dependency monitoring covers building the inventory and deciding who gets paged when somebody else's service fails.

Ahead of the event, do three concrete things. Write down every external service in the revenue path with its expected response time and its owner. Put a monitor on each one so you have your own measurement rather than a vendor's opinion. And confirm that any rate limits or plan quotas on those services are sized for the traffic you are about to send, because a payment API that throttles you at ten times normal volume is a limit you would much rather discover in November than on the day.

Game Day: Watching, Deciding, and Communicating

On the day itself, the job changes from configuration to interpretation. The dashboard will show a lot of movement that is entirely normal for a site under load, and the skill is separating "busy" from "failing".

Watch the shape rather than the numbers. Response time rising smoothly with traffic is expected. Response time rising while traffic is flat means something behind the site is degrading on its own. Response time that steps up and stays up usually means a resource has saturated and is not recovering, which is the signal that most often precedes a full outage. Error rate is the other leading indicator: a small but rising percentage of 500s across several endpoints is a queue filling somewhere, and it is worth acting on before it becomes the whole site. The HTTP status code reference is useful for deciding which codes justify waking somebody.

Have decisions pre-agreed so nobody is improvising under pressure. Typical ones worth writing down in advance:

  • At what point do you turn off non-essential features such as personalisation, live chat, or recommendation widgets to shed load?
  • At what point do you enable a queue or waiting room, and who has the authority to do it?
  • At what point do you pause paid media rather than pay to send traffic to a struggling site?
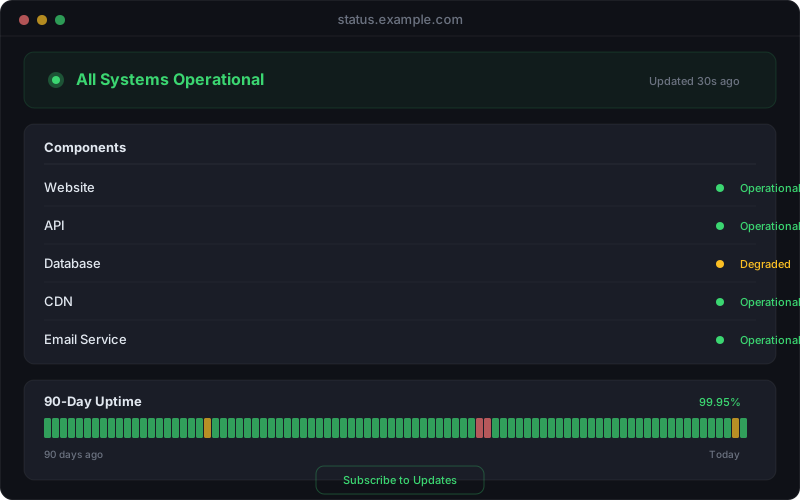
  • Who publishes to the status page, and at what threshold?
PulseStack status page showing component level status, an active incident update, and historical uptime during a high traffic event
A status page updated early turns an outage from a mystery into a manageable customer conversation

Communication is the part teams under-invest in and regret. During a sale, a site that is down without explanation generates support volume that outlasts the incident by days. A public status page updated within a few minutes of detection, with a plain statement of what is affected and when the next update will come, absorbs most of that. Prepare the holding messages beforehand, because writing clear copy while an incident is in progress is not where you want your attention. The status page guide covers structuring components and updates so the page is genuinely useful rather than a second thing to worry about.

Keep a running timeline as you go. Timestamps for detection, acknowledgement, each action taken, and recovery. It takes almost no effort in the moment and it is the difference between a useful review afterwards and four people remembering the same hour differently.

After the Event: Turning One Peak Into Next Year's Baseline

The week after a peak event is when the most valuable work happens, and it is also when everybody is tired and wants to move on. Protect a couple of hours for it.

Start with the numbers, while they are still accurate:

  • Peak concurrent traffic and peak requests per minute, so next year's capacity planning starts from a real figure.
  • Response time at the peak versus the baseline, per page type. This tells you exactly which parts of the site scale and which do not.
  • Every alert that fired, sorted into genuine, early warning, and noise. The noise category is your threshold tuning list for next time.
  • Total unavailability, measured properly against the checks rather than estimated from memory.
  • Time to detect and time to recover for each incident, which is the honest measure of whether the monitoring did its job. The MTTR guide covers how to break that down into detection, diagnosis, and repair so you improve the right stage.

Then run a proper review of anything that went wrong, blameless and focused on contributing factors rather than a single culprit. Peak incidents almost never have one cause: they have a capacity limit nobody knew about, a threshold set too high, an alert that went to a channel nobody was watching, and a runbook that was out of date, all arriving together. The post-incident review template gives you a structure and, more importantly, a way of making the action items actually get done.

Finish by reversing the temporary changes deliberately rather than letting them drift. Restore normal check intervals if cost matters, relax the peak thresholds back to sustainable levels, lift the change freeze, and thank whoever sat watching a dashboard on a Friday night. Then write the whole thing down as a runbook, because next year the event will be bigger, the team will be slightly different, and the version of you that prepared properly this time is the only person who can help.

PulseStack monitors the full revenue path from multiple locations with one minute checks, content assertions, response time thresholds, and severity based alert routing, plus a hosted status page for the moments when something does go wrong. See how website monitoring works, explore the full feature set, or compare plans before your next peak.

Start monitoring your infrastructure today

50 free monitors, no credit card needed. Set up in under 30 seconds.

Get started free