Concept22 June 2026· 11 min read

SLA vs SLO vs SLI: Understanding Service Level Metrics

Why Service Level Metrics Matter

Three acronyms dominate every serious conversation about reliability: SLA, SLO, and SLI. They sound interchangeable, they are routinely confused, and the confusion is expensive. A team that conflates an SLA with an SLO ends up either over-promising to customers or under-investing in reliability. A team with no SLIs at all is flying blind, arguing about whether the service is "up" without any agreed definition of what "up" means.

The three terms are not synonyms. They form a hierarchy. An SLI is something you measure. An SLO is a target you set for that measurement. An SLA is a contractual promise, usually with financial consequences, built on top of those targets. Get the relationship right and you have a coherent framework that connects raw telemetry all the way up to commercial commitments. Get it wrong and you have a pile of dashboards nobody trusts and a contract you cannot honour.

This guide explains each term precisely, shows how they fit together, and gives you a practical method for defining your own service levels. Whether you run a two-person SaaS or a large engineering organisation, the same principles apply. The goal is to move from vague intentions about reliability to measurable, enforceable, and ultimately achievable commitments, backed by the kind of continuous website monitoring that turns these definitions into live signals rather than aspirations.

What Is an SLI? The Thing You Actually Measure

A Service Level Indicator (SLI) is a quantitative measure of some aspect of the service that matters to users. It is a number, derived from real data, that tells you how the service is performing right now and over time. Crucially, a good SLI measures what users experience, not what is convenient to collect.

The most common and useful SLIs fall into a handful of categories:

  • Availability: the proportion of valid requests that succeed. If 9,995 of 10,000 requests returned a successful response, your availability SLI for that window is 99.95%.
  • Latency: the proportion of requests served faster than a threshold. Rather than a single average, this is usually expressed as a percentile: "95% of requests completed in under 300ms."
  • Error rate: the proportion of requests that failed, often broken down by error class (5xx server errors versus 4xx client errors).
  • Throughput: requests handled per second, useful for capacity-oriented services.
  • Correctness: for data pipelines and APIs, the proportion of responses that are not just successful but actually right.

The recommended way to express an SLI is as a ratio of good events to valid events, multiplied by 100: SLI = (good events / valid events) × 100. This formulation is powerful because it is bounded between 0 and 100%, it is intuitive, and it composes cleanly across time windows.

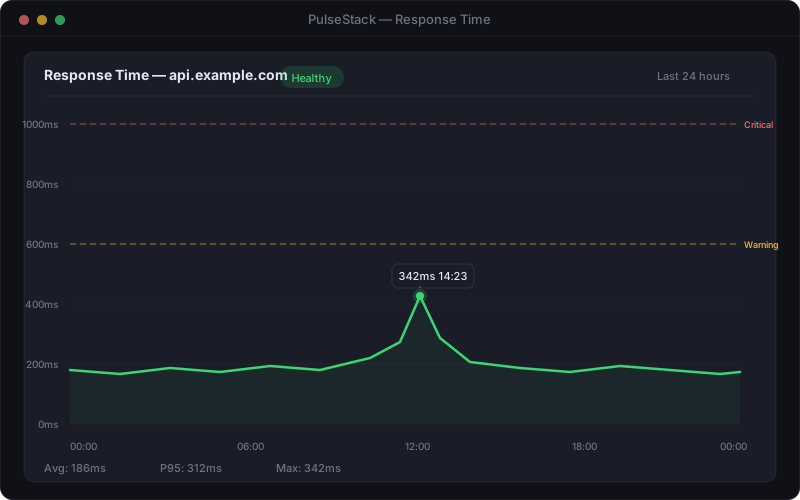
PulseStack response time monitoring chart showing latency percentiles plotted against warning and critical thresholds over time
Latency SLIs are best expressed as percentiles against a threshold, not as a single average that hides the slow tail of requests

Averages are a trap. An average response time of 200ms can hide the fact that 5% of your users are waiting four seconds. Because those slow requests are often your most engaged users (the ones loading the most data), percentile-based SLIs (p95, p99) reflect real experience far better. When you configure status code monitoring and response time checks, you are generating exactly the raw events an availability or latency SLI needs.

One discipline matters more than any other when choosing SLIs: measure from the user's perspective. A server that reports itself healthy while users see timeouts is failing, regardless of what the internal health check says. This is why multi-location monitoring is foundational: an SLI measured only from inside your own data centre tells you nothing about the user in Sydney hitting a regional outage.

What Is an SLO? The Target You Commit To Internally

A Service Level Objective (SLO) is a target value or range for an SLI, measured over a defined period. If your availability SLI is "proportion of successful requests," your SLO might be "99.9% of requests succeed, measured over a rolling 30-day window." The SLO turns a raw measurement into a goal the team agrees to meet.

SLOs are internal. They are the reliability targets your engineering team holds itself to, and they should be set more strictly than any external promise you make. The reason is simple: you need a margin of safety between the level you aim for and the level you have contractually guaranteed. If your customer SLA is 99.9%, your internal SLO should be 99.95% or tighter, so that normal variation never breaches the contract.

The Reality of the Nines

Reliability targets are conventionally expressed in "nines." The difference between each level is dramatic, because each additional nine reduces allowed downtime tenfold:

SLODowntime per monthDowntime per year
99% (two nines)7.2 hours3.65 days
99.9% (three nines)43.2 minutes8.76 hours
99.95%21.6 minutes4.38 hours
99.99% (four nines)4.32 minutes52.6 minutes
99.999% (five nines)26 seconds5.26 minutes

The jump from three nines to four is not a 0.09% improvement in effort; it is roughly a tenfold increase in engineering cost. Five nines (just over five minutes of downtime a year) requires redundant everything, automated failover, and a mature operational culture. Most products do not need it, and chasing it wastes resources that would deliver more value elsewhere.

Setting the Right Target

The correct SLO is the loosest one your users will tolerate. Setting an SLO higher than users actually need is a common and costly mistake: every additional nine constrains your ability to ship features, because more engineering time goes to reliability. A useful test is to ask what level of reliability would make users start to leave or complain. Set your SLO just above that threshold, not at the theoretical maximum.

SLOs should also be specific to the user journey. The checkout flow on an e-commerce site warrants a far tighter SLO than the help-centre search. Differentiating critical paths from non-critical ones lets you spend your reliability budget where it actually protects revenue.

What Is an SLA? The Promise With Consequences

A Service Level Agreement (SLA) is a formal contract between a service provider and its customers that defines the level of service expected and the remedies if that level is not met. Where an SLO is an internal goal, an SLA is an external, legally binding commitment, and breaching it usually costs money.

A complete SLA typically specifies:

  • The guaranteed service level: for example, "99.9% monthly uptime," with a precise definition of how uptime is measured and what counts as downtime.
  • The measurement method and window: exactly how availability is calculated, over what period, and using whose data.
  • Exclusions: scheduled maintenance windows, force majeure, and customer-caused issues that do not count against the SLA.
  • Remedies: what the customer receives if the SLA is breached, usually service credits (a percentage of the monthly fee refunded) on a sliding scale tied to severity.
  • Claim process: how and within what timeframe a customer must request credits.

The critical insight is that an SLA should always be weaker than your internal SLO. Your SLO is what you aim for; your SLA is what you promise. The gap between them is your safety margin. If you publicly guarantee 99.9% but internally target only 99.9%, you have zero room for the inevitable bad month, and you will be paying out service credits regularly. Mature providers guarantee 99.9% externally while running internal SLOs of 99.95% or higher.

An SLA you cannot consistently beat is not a guarantee; it is a recurring liability. Promise less than you can deliver, then deliver more.

SLAs also create an obligation to measure independently and credibly. When a customer disputes whether you met your guarantee, you need authoritative, third-party-style data on actual availability. This is precisely where external monitoring earns its place: a record of checks from multiple locations, with timestamps and response codes, provides the evidence base for honouring, or fairly contesting, an SLA claim. Building that evidence trail starts with the right monitoring foundation, available on every PulseStack plan.

How SLIs, SLOs, and SLAs Fit Together

The three concepts form a clean pipeline from measurement to commitment. Understanding the flow is the single most useful thing you can take from this guide:

  1. SLI, you measure. Instrument the service to collect indicators that reflect user experience: availability, latency, error rate.
  2. SLO, you target. Set internal objectives for those indicators, stricter than anything you promise externally, scoped to the user journeys that matter.
  3. SLA, you promise. Make external commitments that sit comfortably inside your SLOs, with defined remedies if breached.

A worked example makes this concrete. Suppose you run a payments API:

  • SLI: the proportion of API requests that return a 2xx status within 500ms, measured from external probes in five regions.
  • SLO: 99.95% of requests meet that bar over a rolling 28-day window, your internal target.
  • SLA: you guarantee customers 99.9% monthly availability, with 10% service credit if you fall below 99.9% and 25% if you fall below 99.0%.

The 0.05% gap between your SLO and your SLA is your error budget cushion at the contractual level. Your team works to the 99.95% SLO; the contract only bites at 99.9%, so a single rough patch does not automatically trigger payouts.

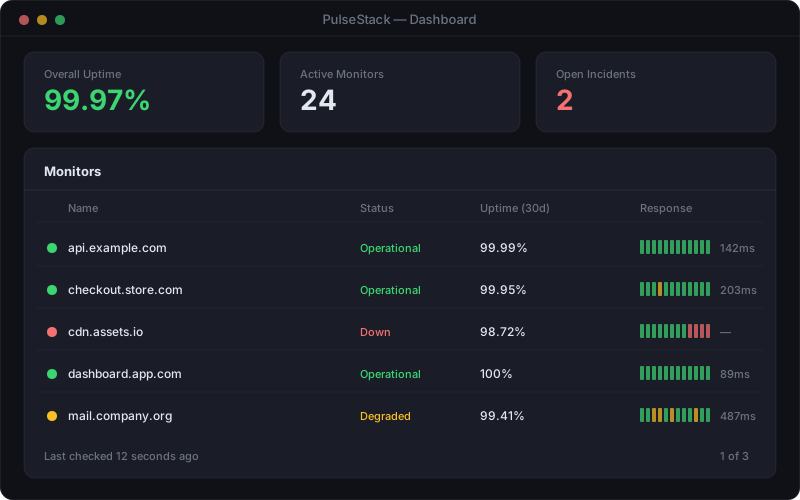
PulseStack uptime monitoring dashboard showing availability percentage, current SLO status, and remaining error budget across monitored services
A monitoring dashboard surfaces SLI values, SLO compliance, and remaining error budget in one place, turning abstract targets into live operational signals

Not every SLO needs to sit under an SLA. Many internal SLOs exist purely to guide engineering priorities and never appear in any customer contract. That is healthy. The point of an SLO is to give the team a shared, measurable definition of "good enough" so that reliability decisions are data-driven rather than emotional. The SLA layer is only added where a commercial promise is genuinely required.

Error Budgets: Turning SLOs Into Decisions

The most valuable practical tool that flows from a well-defined SLO is the error budget. The concept is elegant: if your SLO is 99.9% availability, then you are explicitly accepting 0.1% unavailability. That 0.1% is not a failure; it is a budget. It is the amount of unreliability you are permitted to spend.

For a 30-day month, a 99.9% SLO gives you an error budget of roughly 43 minutes of downtime. As long as you stay within that budget, the service is meeting expectations and the team is free to ship features at full speed. When you exhaust the budget, the policy changes: feature work pauses and engineering effort redirects to reliability until the budget recovers.

Why Error Budgets Resolve the Eternal Conflict

Error budgets defuse the perennial tension between product teams (who want to ship fast) and operations teams (who want stability). Without a shared metric, this is an endless argument driven by gut feeling. With an error budget, it becomes a simple, data-driven rule:

  • Budget remaining: ship freely. The service is reliable enough; the priority is velocity.
  • Budget exhausted: freeze risky changes and invest in reliability until you are back within SLO.

This reframes reliability from a vague virtue into a quantified resource that the whole organisation can reason about. It also makes the cost of instability visible: a botched deployment that burns half the month's error budget in one afternoon is now a concrete, measurable event with agreed consequences, not just a bad day.

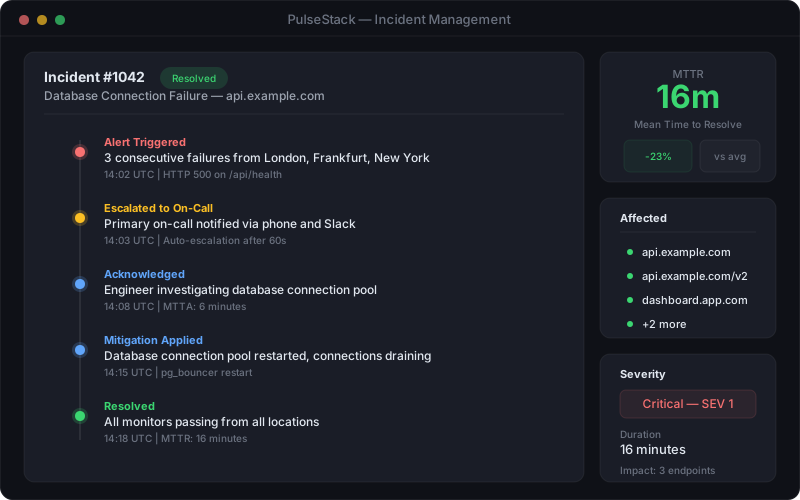
PulseStack incident timeline showing an outage event, its duration, and the resulting consumption of the monthly error budget
Each incident consumes a measurable slice of the error budget, making the reliability cost of every outage explicit and trackable

Burn Rate Alerting

Sophisticated teams alert on error budget burn rate rather than on raw threshold breaches. Instead of paging when availability dips below 99.9% for a moment, you page when the budget is being consumed fast enough to threaten the whole window. A burn rate of 1 means you will exactly exhaust the month's budget by the end of the month; a burn rate of 14.4 means you will exhaust it in a single day. Alerting on sustained high burn rates catches genuinely dangerous trends while ignoring the brief blips that drive alert fatigue. The result is fewer, higher-signal pages for your on-call engineers.

Implementing Service Levels in Practice

Theory is easy; implementation is where most teams stall. Here is a pragmatic sequence for introducing service level metrics without trying to boil the ocean.

Step 1: Pick One Critical Journey

Do not attempt to define SLOs for every endpoint at once. Choose the single most important user journey (the login flow, the checkout, the core API call) and define service levels for it first. You will learn more from one well-instrumented journey than from twenty half-baked ones.

Step 2: Define and Measure the SLI

Decide precisely what counts as a "good" event for that journey, then start measuring. External synthetic checks are the fastest way to begin: configure monitors that exercise the journey from multiple locations and record success, failure, and response time. Within days you will have a baseline of real availability and latency data: the raw material for any SLO. Setting this up takes minutes with the right monitoring features.

Step 3: Set a Realistic SLO From the Baseline

Resist the urge to pick a round number out of the air. Look at your actual measured performance over the past few weeks and set an SLO that is achievable but slightly aspirational. If you are currently running at 99.92%, do not commit to 99.99%; set an SLO of 99.9% and earn the extra nines through deliberate engineering work over time.

Step 4: Derive the Error Budget and Agree the Policy

Translate the SLO into a concrete error budget for your window, then agree in writing what happens when it runs out. The policy needs buy-in from both engineering and product leadership before you need it, not during the incident when emotions run high.

Step 5: Only Then Consider an SLA

Once you have a few months of evidence that you reliably beat your internal SLO, you are in a position to make external promises. Set the SLA comfortably below your demonstrated SLO performance, define the exclusions and remedies clearly, and ensure you have independent monitoring data to back every claim, both yours and your customers'.

Common Pitfalls to Avoid

  • Vanity SLOs: targets set for appearance rather than need. Five nines on a blog is wasted money.
  • Measuring the wrong thing: internal health checks that report green while users see errors. Always measure from the user's edge.
  • SLA tighter than SLO: guaranteeing externally what you only aim for internally, leaving no safety margin.
  • Ignoring the error budget: defining one and then shipping recklessly regardless. The budget only works if the policy is enforced.
  • Set and forget: service levels need periodic review as the product, traffic, and user expectations evolve.

Service level metrics are not bureaucracy; they are the language reliability is spoken in. Master the distinction between what you measure (SLI), what you target (SLO), and what you promise (SLA), and you give your whole organisation a shared, honest framework for reasoning about reliability. The starting point is always measurement, and you can have credible, multi-location SLI data flowing within minutes by setting up monitoring on the journeys that matter most. From there, every other layer becomes achievable.
Start monitoring your infrastructure today

50 free monitors, no credit card needed. Set up in under 30 seconds.

Get started free