Concept30 July 2026· 10 min read

Observability vs Monitoring: What Is the Difference?

Two Words, Two Different Jobs

Few debates in modern operations generate as much confusion as observability vs monitoring. Vendors use the terms interchangeably in marketing copy, engineers use them to mean subtly different things in the same meeting, and newcomers are left with the impression that observability is simply the newer, more expensive word for monitoring. It is not. The two disciplines answer genuinely different questions, and understanding which question you are asking is the fastest way to decide what you actually need to buy and build.

The shortest honest summary is this. Monitoring tells you that something is wrong. Observability helps you work out why. Monitoring watches a defined set of signals and fires when one of them leaves its expected range. Observability is the property of a system that lets you ask new questions of it after the fact, including questions you never anticipated when you instrumented it. One is a smoke alarm; the other is the ability to walk through the building and find the source of the smoke.

That distinction matters commercially as well as technically. Monitoring is comparatively cheap, quick to set up, and delivers value on day one. Observability platforms are powerful but expensive, data-hungry, and only pay off once your system is complex enough that "what broke?" is genuinely hard to answer. Teams routinely get this backwards: they buy a sophisticated observability stack while still lacking a basic external check that tells them the site is down. This guide untangles the two, explains where each one earns its keep, and shows how they work together. If you are new to the fundamentals, our complete guide to uptime monitoring is the natural companion piece.
What Monitoring Actually Does

Monitoring is the practice of collecting a predefined set of measurements, comparing them against expected values, and alerting a human when reality diverges from expectation. The defining characteristic is that you decide in advance what to watch. You choose the checks, you choose the thresholds, and the system faithfully reports on exactly those things and nothing else.

In practice, a healthy monitoring setup covers a fairly stable list of concerns:

  • Availability: is the service reachable and returning a successful response from outside your network?
  • Response time: how long is the service taking, and has that number drifted beyond an acceptable band? Covered in depth in our guide to response time thresholds.
  • Correctness signals: is the response status code what you expect, does the page contain the keyword it should, is the JSON payload shaped correctly?
  • Infrastructure health: certificate expiry, DNS resolution, disk space, memory, queue depth, and the other resources that quietly run out.
  • Scheduled work: did the nightly job actually run, or did it fail silently?
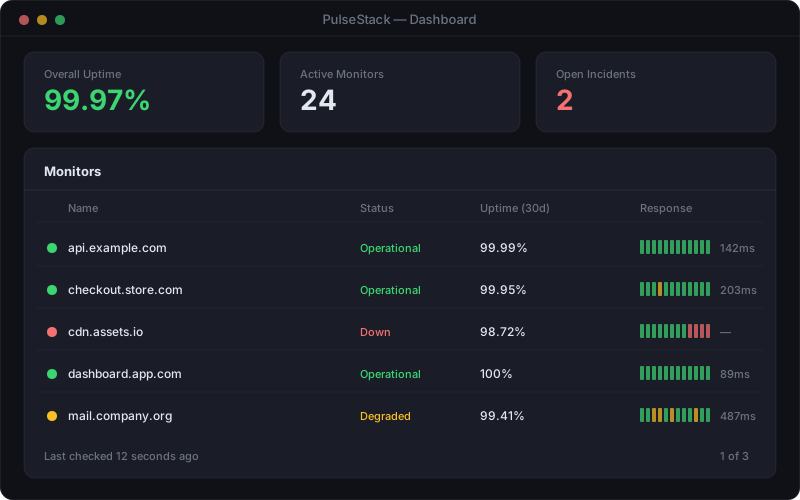
PulseStack uptime monitoring dashboard showing availability percentages, current status, and check history across multiple monitored endpoints
Monitoring answers a closed question well: are the things we chose to watch behaving as expected right now?

The strength of monitoring is its clarity. A check either passes or it fails, and the resulting alert is unambiguous. It is also the only layer that works from the outside in. Internal telemetry cannot tell you that your DNS provider is returning stale records to users in another country, or that a firewall rule is blocking traffic before it reaches your application, because in both cases your application never sees the request at all. An external monitor sees exactly what a customer sees, which is why it remains the foundation of any reliability programme regardless of how sophisticated the rest of the stack becomes.

The weakness is equally clear: monitoring only ever reports on what you thought to measure. It will tell you that checkout latency has doubled. It will not tell you that the cause was a single misbehaving shard affecting customers whose surname begins with a particular letter range. For that, you need something else.

What Observability Adds

Observability borrows its name from control theory, where a system is described as observable if you can determine its internal state purely from its external outputs. Applied to software, it means your system emits enough rich, high-cardinality telemetry that you can reconstruct what it was doing during any given moment without having to ship new code to find out.

The practical difference is the type of question you can ask. Monitoring supports questions you wrote down in advance: "is error rate above 1%?" Observability supports questions invented on the spot in the middle of an incident: "show me every request in the last twenty minutes that took longer than four seconds, came from the mobile app, hit the European region, and touched the payments service, then break that down by customer tier." Nobody built a dashboard for that query, because nobody knew it would be needed. A genuinely observable system can answer it anyway.

This capability rests on high-cardinality, high-dimensional data. Cardinality refers to the number of distinct values a field can take. A field like environment has low cardinality with maybe three values. A field like user ID or request ID has extremely high cardinality with millions of values, and it is precisely those fields that let you narrow a vague symptom down to a specific cause. Traditional metrics systems struggle badly with high cardinality because each unique combination of labels creates a separate time series, and costs explode. This is the core technical reason observability platforms are architected differently, and the core commercial reason they cost more.

Observability also changes the debugging workflow. Rather than forming a hypothesis, adding logging, deploying, and waiting for the problem to recur, you interrogate data you already have. That shift is worth real money during an incident, because the slowest part of most outages is not fixing the problem but finding it, which is exactly the component of mean time to recovery that teams most often fail to improve.

Logs, Metrics, and Traces

Observability is conventionally described as resting on three pillars. The framing is imperfect, because the pillars are data types rather than outcomes, but it remains the most useful way to understand what an observability stack is made of.

  • Metrics are numeric measurements aggregated over time: request count, error rate, queue depth, CPU utilisation. They are cheap to store, fast to query, and ideal for dashboards and alerting. Their limitation is that aggregation discards detail, so a metric can tell you error rate rose without telling you which requests failed.
  • Logs are timestamped records of discrete events, ideally structured as key and value pairs rather than free text. They carry the detail metrics throw away. Their limitation is volume and cost: verbose logging at scale becomes expensive quickly, and unstructured logs are painful to query.
  • Traces follow a single request as it travels across every service it touches, recording timing and metadata at each hop. In a distributed architecture this is the pillar that matters most, because it turns "the API was slow" into "the API was slow because the third of five downstream calls waited 3.2 seconds on a database lock".
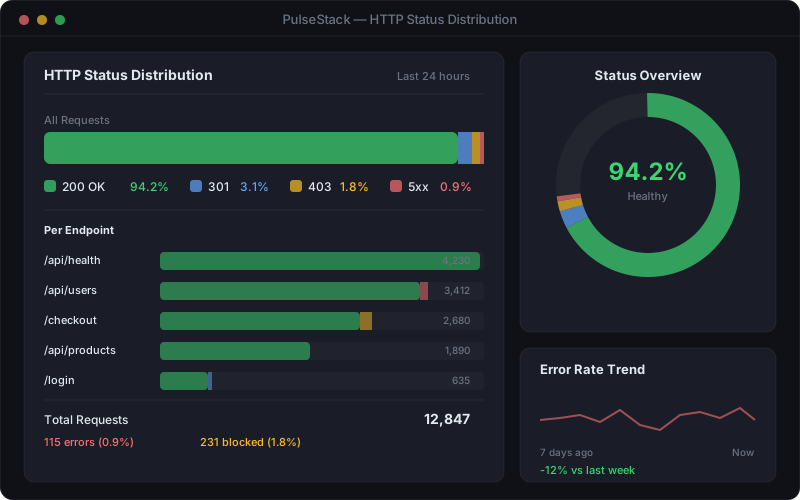
PulseStack HTTP status code breakdown chart showing the distribution of successful, redirect, client error, and server error responses over time
Aggregated signals such as status code distribution show the shape of a problem; traces and structured logs explain the individual requests behind it

The pillars are strongest when connected. A metric shows error rate climbing at 14:05. You click through to traces from that window and see a cluster of failing requests sharing a downstream dependency. You open the structured logs attached to one of those traces and find the exact exception. That path from symptom to cause in three steps is what a mature observability practice buys you, and it is why correlation between the three data types matters far more than the completeness of any one of them.

It is worth noting that a fourth signal, events, is increasingly treated as first class. Knowing that a deployment, feature flag change, or configuration update happened at 14:04 explains an enormous proportion of incidents on its own. If you record nothing else, record your changes.

Known Unknowns and Unknown Unknowns

The cleanest mental model for the distinction comes from the language of risk. Monitoring handles known unknowns. Observability handles unknown unknowns.

A known unknown is a failure mode you can anticipate even though you cannot predict when it will occur. You know the certificate will eventually expire, that the disk will eventually fill, that the site will eventually be unreachable. You cannot say when, so you set a check and a threshold and let the system tell you. This is a solved problem, and it is solved cheaply. A handful of well-chosen external checks covers the overwhelming majority of incidents that actually take businesses offline.

An unknown unknown is a failure mode nobody imagined. A caching layer that behaves correctly in isolation but produces stale authorisation decisions under a specific race condition. A third-party script that degrades only for users on a particular browser version. A retry storm that only triggers when two independent services are both mildly degraded at once. You cannot pre-build an alert for a scenario you have never conceived of. What you can do is ensure the system emits enough context that, once symptoms appear, you can investigate freely.

This is why the ratio between the two shifts with architecture. A single application server with a database has few unknown unknowns, and its failure modes are largely enumerable. A distributed system of forty services with asynchronous messaging, multiple data stores, and several third-party dependencies generates emergent behaviour nobody designed and nobody predicted. The more distributed the system, the more the balance tips from monitoring toward observability, and the more the investment starts to justify itself.

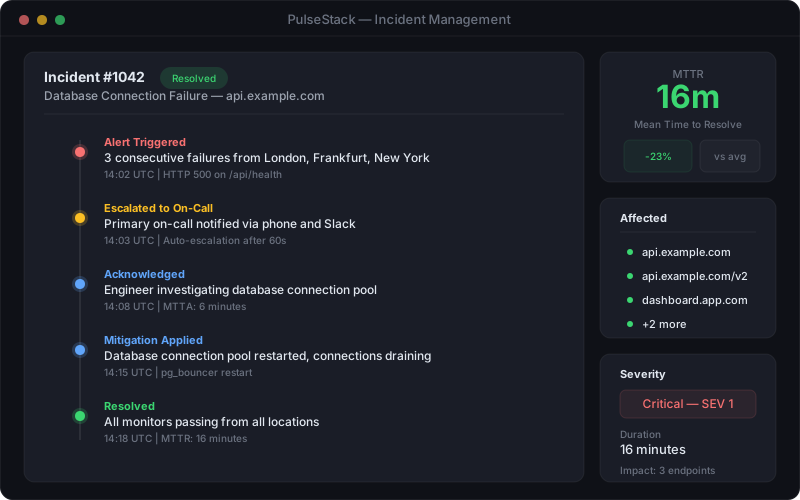
PulseStack incident timeline showing detection, acknowledgement, investigation, and resolution stages of an outage with timestamps
Monitoring compresses the time to detection; observability compresses the far longer investigation phase that follows

Look at any incident timeline and the split becomes obvious. Monitoring owns the first segment, from failure to detection. Observability owns the middle segment, from detection to diagnosis, which is usually the longest and most variable part of the whole timeline. Both segments feed into the same incident management process, and improving either one shortens the outage.

Why It Is Not an Either/Or Decision

Framing this as a competition produces bad decisions in both directions. Teams that dismiss observability as vendor hype spend hours in incidents guessing at causes. Teams that treat observability as a replacement for monitoring end up with beautiful trace waterfalls and no idea their site has been returning a certificate error to visitors for six hours, because every one of their instrumented services believed it was perfectly healthy.

That last failure is more common than it sounds, and it stems from a structural blind spot. Observability is almost entirely an inside-out view: it depends on your code running and emitting telemetry. Anything that prevents a request from reaching your code is invisible to it. Expired certificates, DNS misconfiguration, CDN or edge failures, regional network partitions, firewall changes, and hosting provider outages all fall into that category, and collectively they cause a substantial share of real-world downtime. Only an external check, run from outside your infrastructure, catches them. This is the same outside-in versus inside-out distinction explored in our comparison of synthetic monitoring versus real user monitoring.

A sensible way to think about the relationship is layered. External monitoring forms the outermost layer and confirms that customers can reach and use the service. Metrics and service level indicators form the middle layer and quantify how well it is performing against the objectives you have committed to, which is the subject of our guide to SLAs, SLOs, and SLIs. Traces and structured logs form the innermost layer and explain the behaviour of individual requests when the outer layers signal trouble.

Each layer answers a different question, and none substitutes for another. The outer layer tells you whether you have a problem at all. The middle layer tells you how bad it is and whether it breaches your commitments. The inner layer tells you what to fix.

Building a Practice That Uses Both

The right sequence for most teams is to build outward-in and then deepen, because that order delivers protection fastest and defers cost until it is genuinely justified.

Start with external monitoring. Before anything else, ensure something outside your infrastructure checks that your critical user journeys are reachable, fast enough, and returning correct content, from more than one geographic location. This is cheap, takes minutes, and catches the failure modes most likely to cost you customers. Add certificate expiry and DNS checks at the same time, since both cause total outages and both are trivially preventable.

Add metrics and service level objectives next. Define a small number of indicators that genuinely reflect customer experience, typically availability and latency for your most important journeys, and set objectives against them. Resist the urge to instrument everything. A handful of meaningful metrics beats a thousand nobody looks at, and every extra alert you create is a withdrawal from the trust account described in our guide to alert fatigue.

Introduce structured logging. Move from free-text log lines to structured key and value records, and make sure every log entry carries a request identifier. This single change costs very little and dramatically improves your ability to investigate, even before you adopt a full observability platform.

Add tracing when your architecture demands it. The honest trigger for distributed tracing is when a typical user request crosses several services and you can no longer reason about where time is spent. Before that point, tracing is an expensive solution to a problem you do not yet have. After it, tracing is often the difference between a twenty minute diagnosis and a four hour one.

Control cost deliberately. Observability data grows with traffic, and unmanaged growth produces alarming invoices. Sample traces rather than capturing all of them, set retention periods that match how far back you realistically investigate, and be selective about which high-cardinality fields you keep. The goal is enough context to answer real questions, not a complete archive of everything your system has ever done.

Handled in that order, the two disciplines reinforce each other. Monitoring keeps you honest about what customers experience and gives you a dependable, low-noise signal that something needs attention. Observability gives you the depth to explain what that signal means. Neither is a fashion, and neither is a replacement for the other.

PulseStack covers the outermost layer properly: external checks from multiple locations, response time thresholds, certificate and DNS monitoring, and alerting that reaches the right person without drowning them. Explore the website monitoring capabilities, browse the full feature set, or compare the plans to find the right fit. Whatever else your stack grows into, the check that runs from outside your infrastructure is the one you should never be without.

Start monitoring your infrastructure today

50 free monitors, no credit card needed. Set up in under 30 seconds.

Get started free